The PALZ lateral taskbar contains the shortcut button  for the results aggregation. This feature allows concentrating the discrimination results which have been saved in *.palzRes text files for statistic analysis. It opens a dialog window with two tabs as illustrated below.
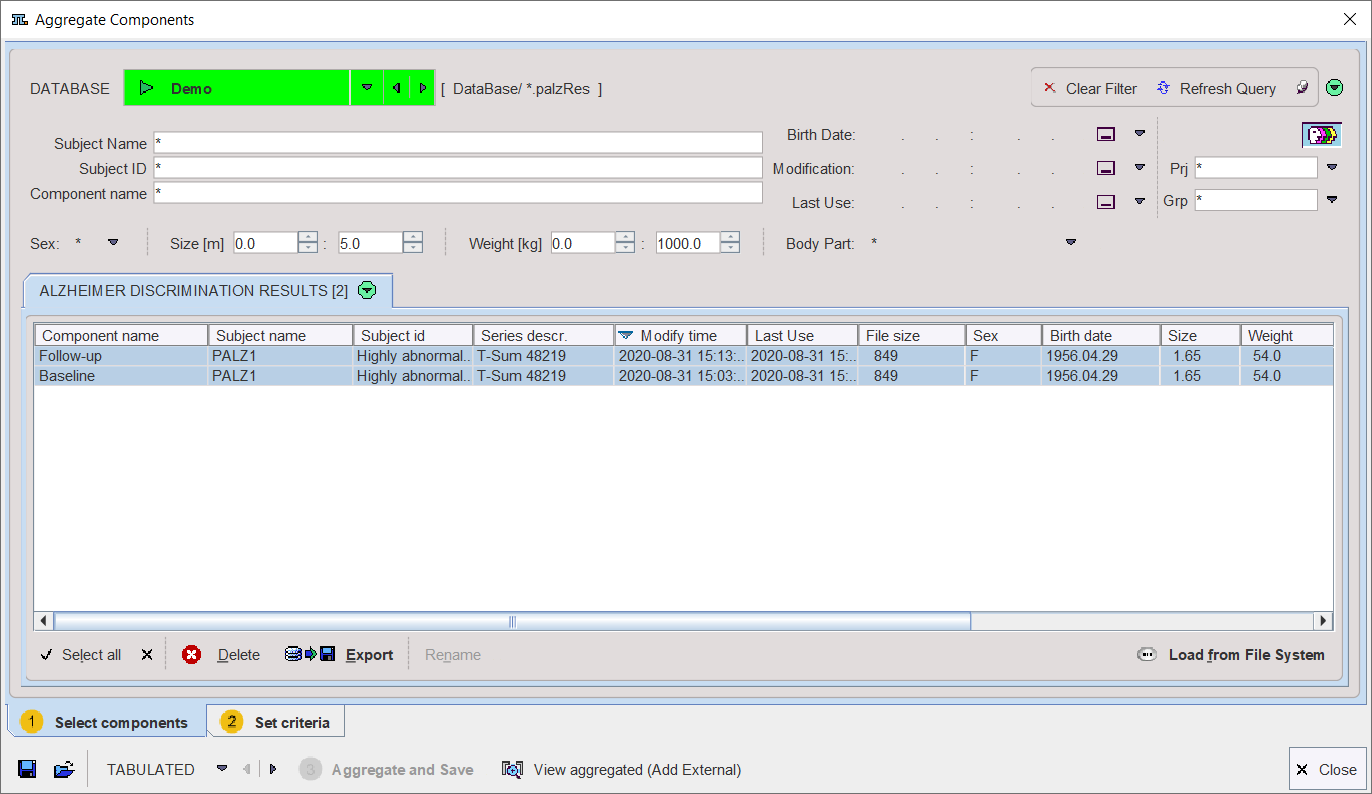
The Select components pane allows defining the files from which the results are extracted. The files may be available in a database as in the example, or alternatively using the Load from File System button to define the directory were the files reside. All appropriate data sets are listed. Select the entries to be used, and then switch to the Set criteria pane.
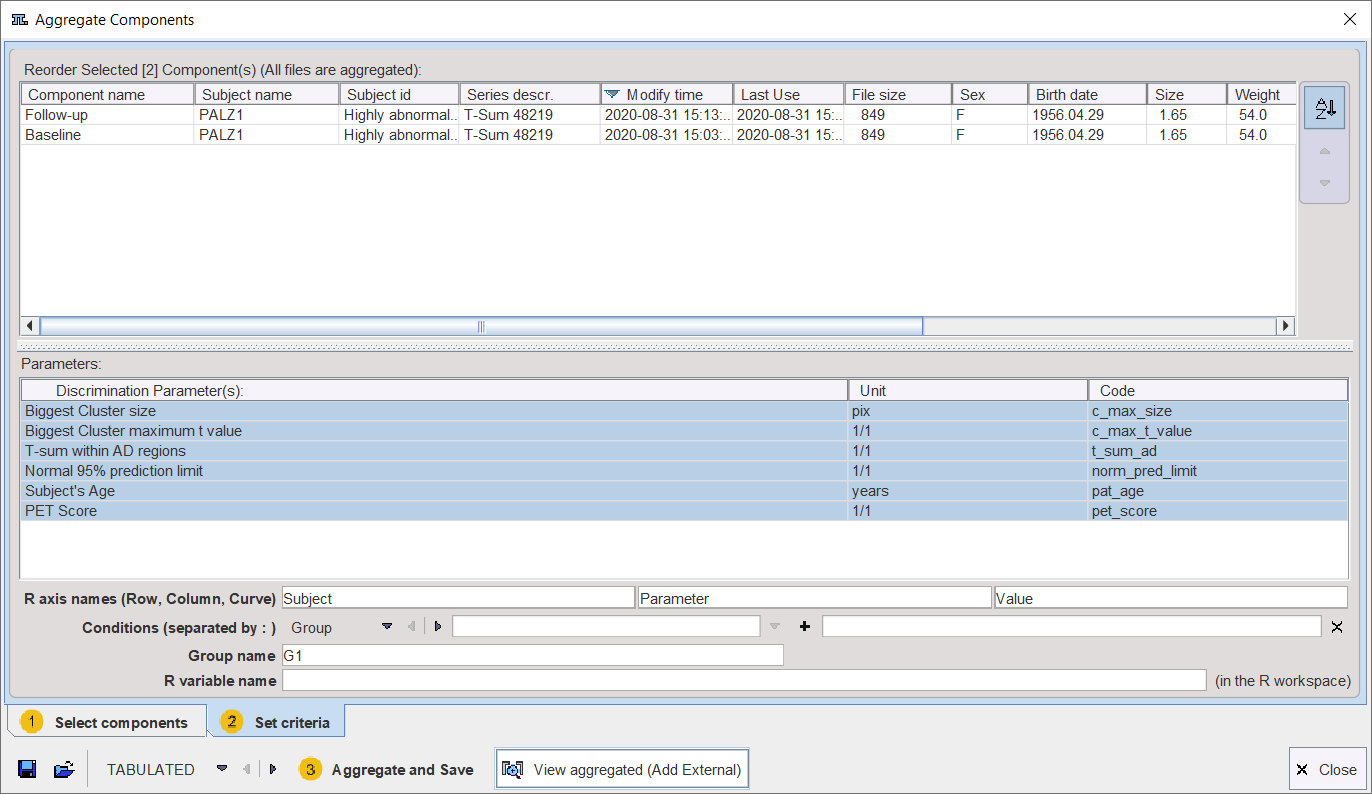
The upper list shows which data sets have been selected. The Discrimination Parameter(s) section shows the different parameters which are available in the data sets. Any of these parameters can be selected (CTRL+left mouse click) for defining which parameters shall be extracted from the data.
Finally, data extraction can be initiated with Aggregate and Save. This function extracts the parameters and saves them in a file which name has to be specified by the user. There are the file formats EXCEL (.xls) and TABULATED (.dbTab) available which has to be selected beforehand. Default output is TABULATED.
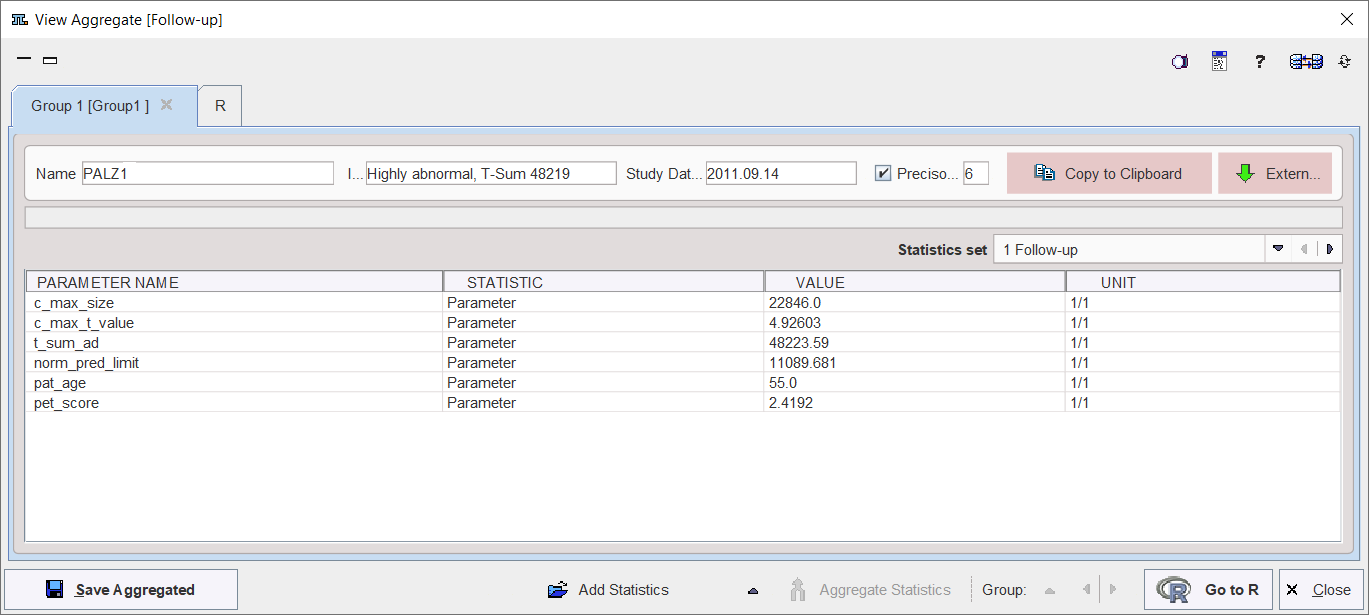
The saved aggregated file can be view with the  button, which is also available on the lateral taskbar. Upon retrieval, a dialog window opens and allows inspecting the aggregation results. The individual PALZ results are available for inspection in the Statistics set selection list. The aggregation results can be exported via the Copy to Clipboard button. Note that the created aggregate can also be loaded into the PMOD R console for statistical analysis.
Combination with External Data
For the statistical analysis, additional data might be relevant, for instance the blood pressure at scan time, or a mini mental test score. Such data can be included with the aggregate using the External button. It shows a dialog window listing the four identifiers Subject Name, Subject ID, Study description and Series description of the included data.
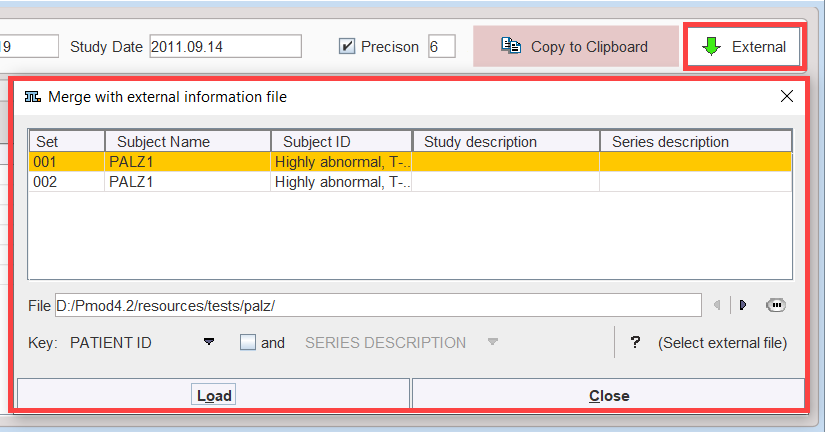
A tab-delimited text File with the external data has to be prepared and selected. It has the following structure, which is also summarized by the ? button:
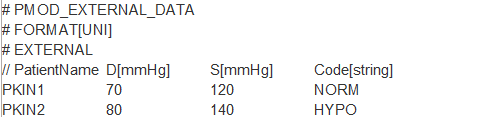
Patient ID or Patient Name can be used as the Key for relating the information in the aggregate and in the file, and if this is not unique, it can be combined with STUDY DESCRIPTION or SERIES DESCRIPTION. Use Load to perform to extend the aggregate, and Save Aggregated to save the result.
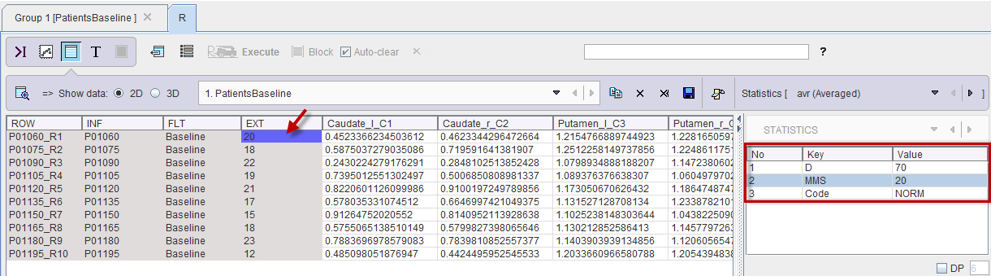
Note that the added external information is not visible in the Group window. However, after transferring the information to R using Go to R, the external values are encoded in the EXT column as illustrated below:
Note: Please note that when numeric PatientName or PatientID are defined, they have to be converted in "char" format in Excel. This can be easily done forcing the content of the Excell cell to a text representation using the character apostrophe ' at the beginning of each name/ID definition (eg. '10). Otherwise the external data will not be read by Pmod.