This tool supports the calculation of T1 maps from dynamic MR series acquired with two different pulse sequences. The Lower and Upper limits serve for restricting the calculated values to a physiological range.
Variable Saturation Data (FLASH)
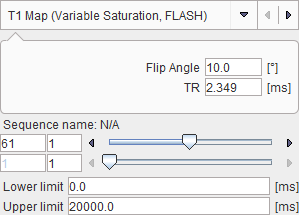
The equation for the signal intensity using a FLASH sequence can be rearranged such that T1 may be calculated as the slope of a linear regression fit. See Buckley et al, equation (5.7).
Inversion Recovery Data
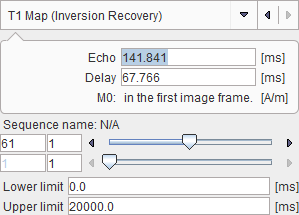
It is assumed that the first frame contains the equilibration magnetization M0. T1 is then estimated using a linear regressioin as described by McVeigh et al [2], using equation (2).
References
1.D.L. Buckley, and G.J.M. Parker, Measuring contrast agent concentration in T1-weighted dynamic contrast-enhanced MRI. in: A. Jackson, D.L. Buckley, and G.J.M. Parker, (Eds.), Dynamic Contrast-Enhanced Magnetic Resonance Imaging in Oncology, Springer, Berlin, 2005, pp. 69-79.
2.McVeigh E, Yang A, Zerhouni E. Rapid measurement of T1 with spatially selective pre-inversion pulses. Medical Physics. 1990;17(1):131-134.