The one-way ANOVA test compares the means between groups and determines whether any of those means is significantly different from the others. It can only detect that least two groups are different, but not which ones. Therefore, a pair-wise post-hoc comparison needs to be applied in the case significance. The ANOVA script applies the Tukey's HSD (Honest Significant Difference) post-hoc test.
Assumptions
One-way ANOVA is based on the following assumptions:
▪the response variable (the dependent variable) is normally distributed;
▪the samples are independent;
▪the group variances are equal.
ANOVA Configuration
The ANOVA configuration window is illustrated below.
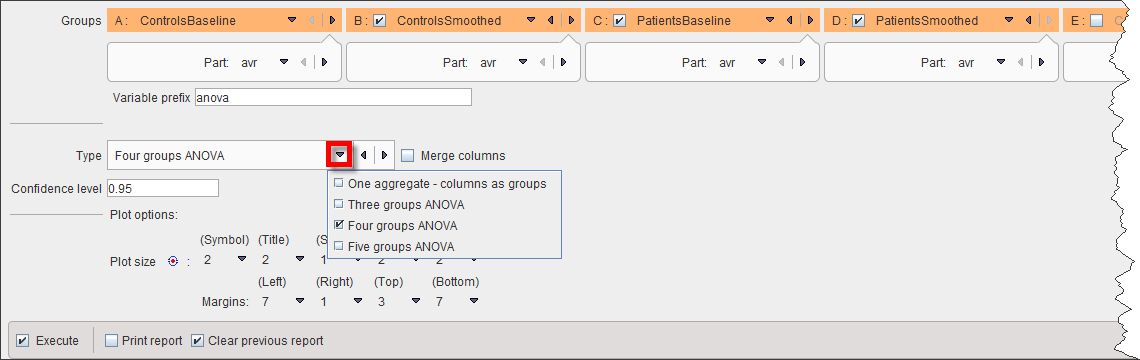
There are two Types of data organizations for the ANOVA script:
1.One aggregate - columns as groups: In this case the groups to be compared are arranged as columns in a single aggregate.
2.Three groups ANOVA, Four groups ANOVA: In these cases the groups to be compared are represented by separate aggregates. If Merge columns is enabled, the data of all columns will be pooled, otherwise the ANOVA analysis is performed between the respective columns of the aggregates which may represent different VOIs.
The Confidence level setting (default 95%) is related to Tukey's HSD test.
ANOVA Results
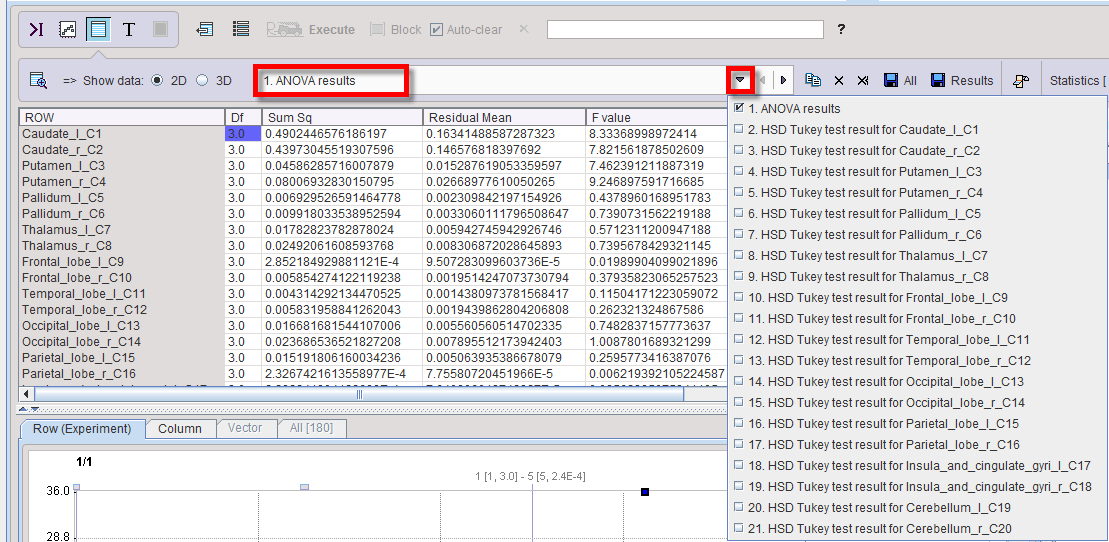
The script produces result two tables per VOI: one related to ANOVA (anova_result), and one related to Tukey HSD (anova_tukey).
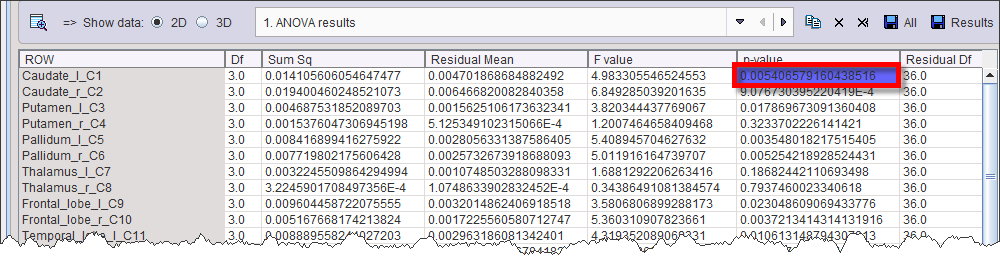
A p-value <0.05 in the ANOVA result table as in the example below indicates that there is a significant difference among the group means.
The corresponding Tukey HSD table
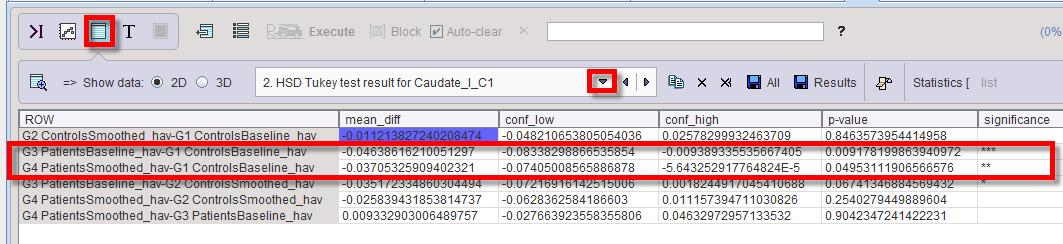
allows identifying G3 being different from G1 and G2, since the p-value is <0.05 for G3-G1 and G3-G2, whereas it is not significant for G2-G1.
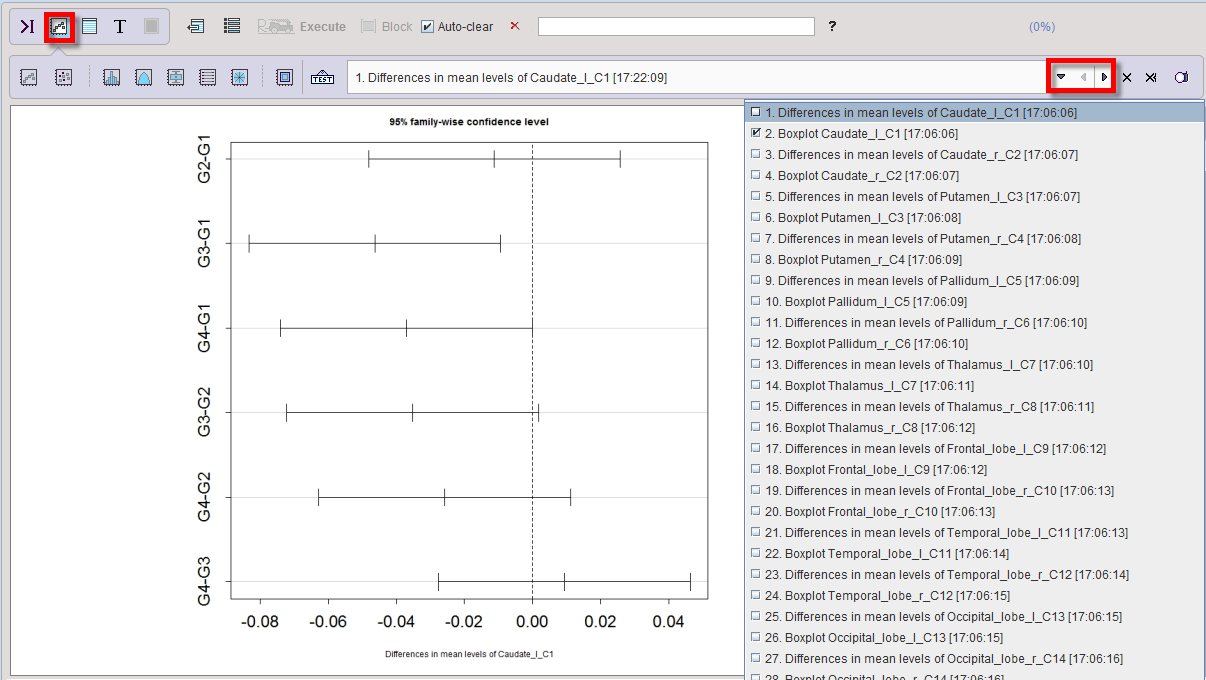
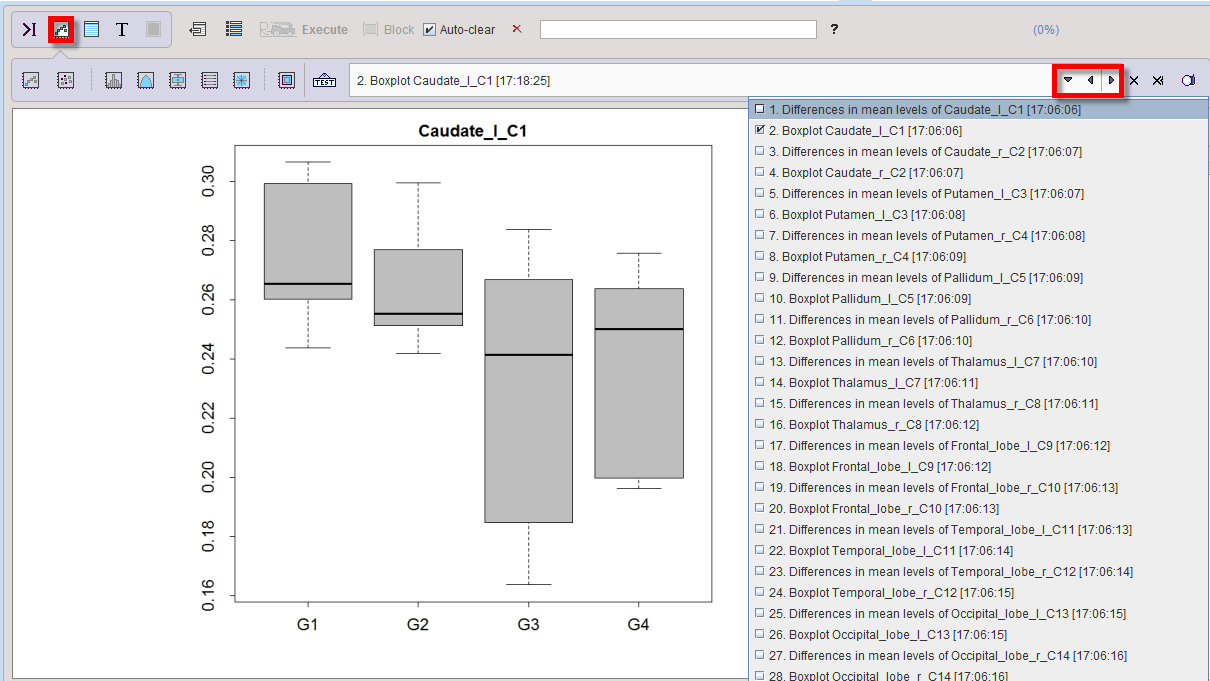
The results are illustrated by two plots per VOI: a box plot summarizing the regional statistics,
and a plot of the Confidence intervals of the group differences from the Tukey's HSD test. If the zero difference is not included in the confidence interval, the group difference is significant.