The Descriptive statistics script serves for summarizing the statistical properties of outcomes assembled in one or several PMOD aggregates.
Descriptive Statistics Configuration
The Descriptive Statistics script shows the following dialog window.
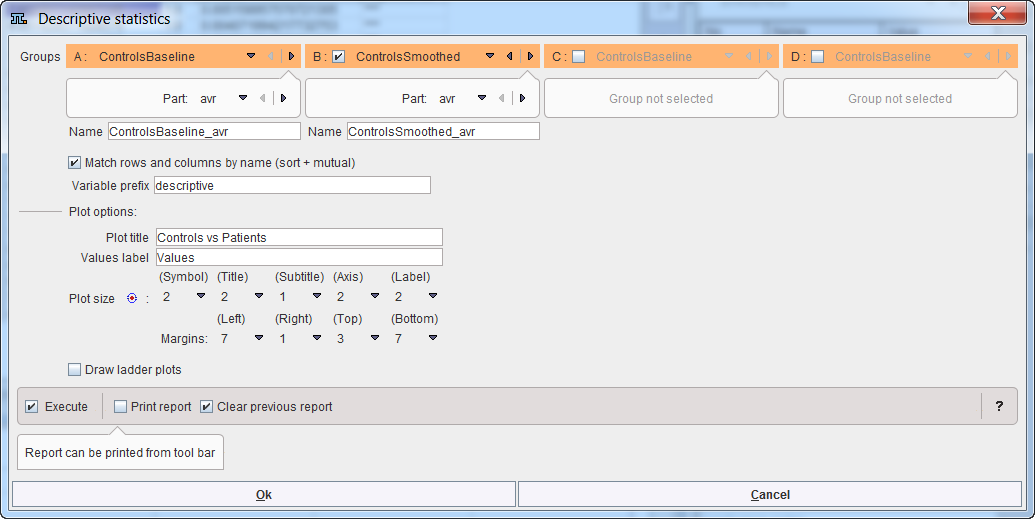
Note that up to 4 data sets can be compared. In the example case 2 Groups are selected and the variables ControlsBaseline and PatientsBaseline. Only one statistic can be compared at a time, to be selected from the Part list. If the parameter names don't match, the program will complain, but still perform the calculation.
The results consist of tables as well as graphic plots. To group the table results a Variable prefix can be specified. Plot title and Values label should be edited such that the plots are meaningfully annotated. The Draw ladder plot option allows visualizing each data point across the three data sets. This is only reasonable, if all groups include the same subjects. In this case, the Match rows and columns by name box should be checked.
Descriptive Statistics Results
After running the script the workspace is populated with new variables, and plots have been generated and added to the plot history. The R console is in the table layout and shows a statistic summary table of the last group. For each VOI it lists the minimum, first quartile (Q1), median, mean, standard deviation, third Quartile (Q3) and maximum across the subjects. The
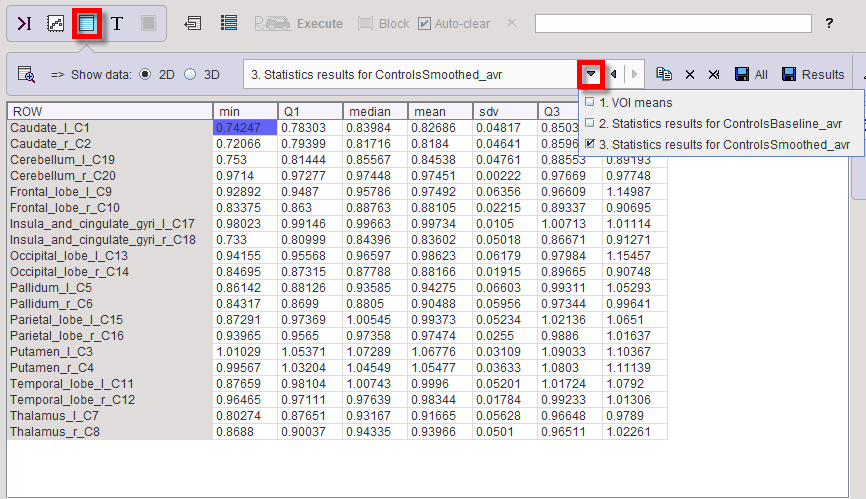
Using the buffer selection, the table can easily switched to the other groups, as well as the VOI Means table which just shows the VOI means and standard deviations for all groups.
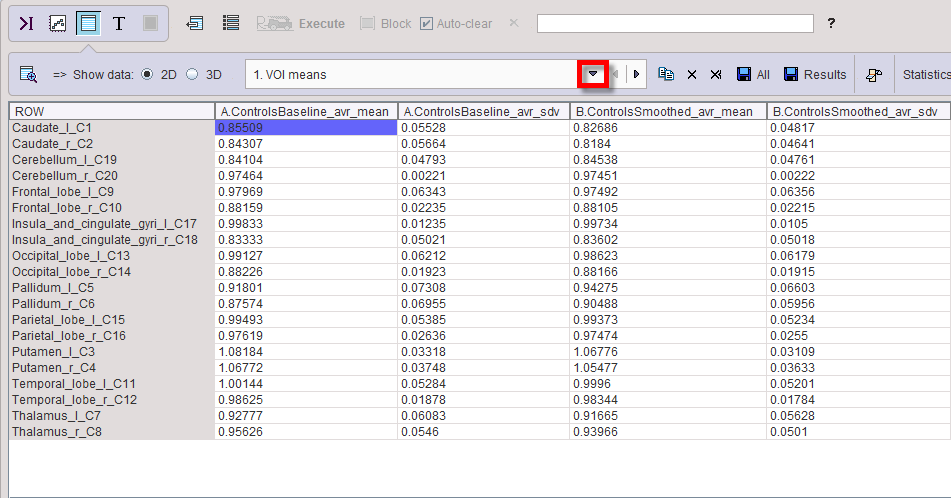
Note the copy and save buttons in the buffer controls for exporting the table data.
The same information as in the tables is visualized by one box plot per VOI, providing a convenient side by side comparison of the groups. Please activate the plot layout and use the buffer arrows to browse through the different VOIs.
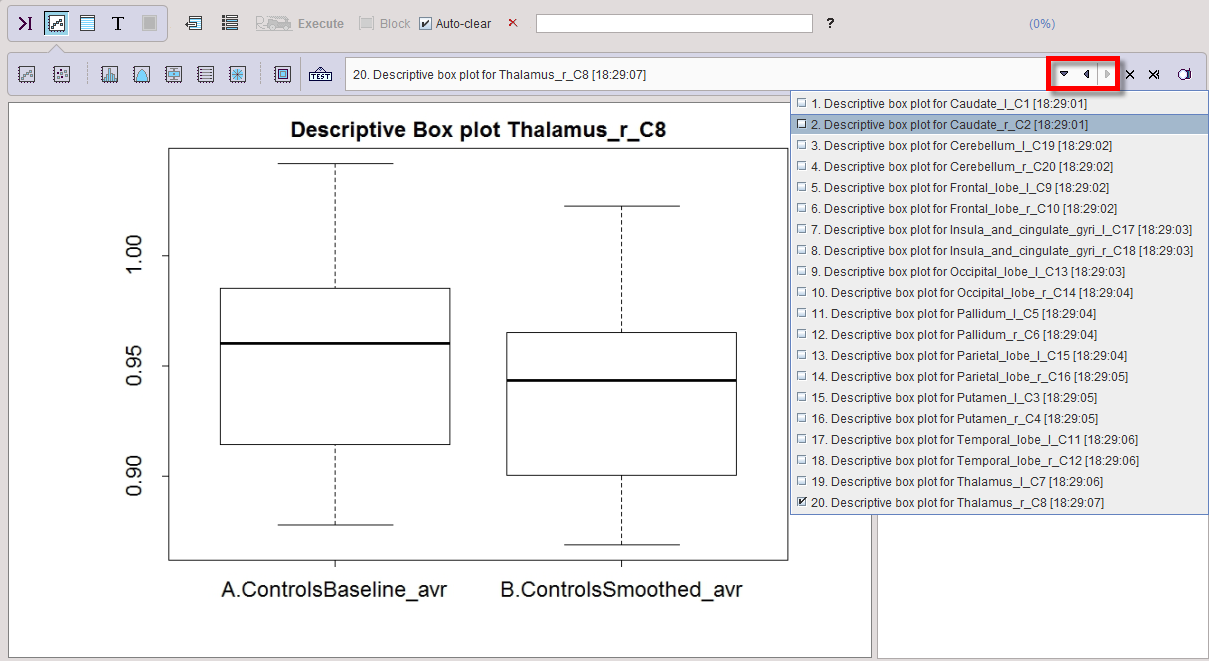
If the Ladder plot option was enabled, box plots are alternated with ladder plots.