There is a general plotting procedure which can be called with the ![]() icon. The user interface allows tailoring it to the plotting task.
icon. The user interface allows tailoring it to the plotting task.
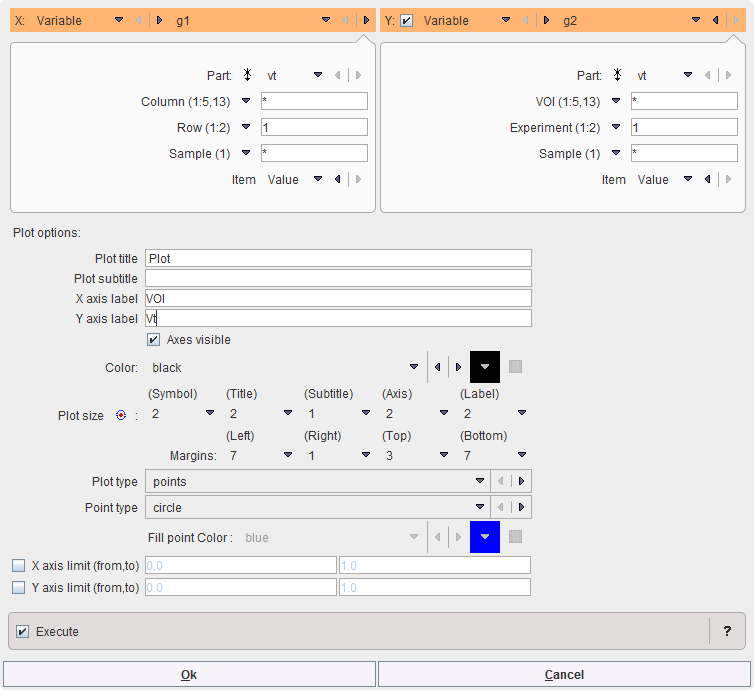
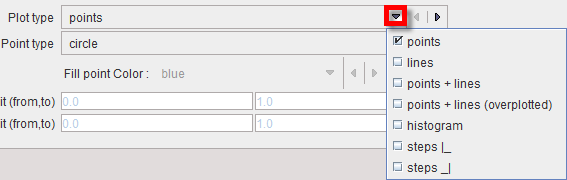
This function is more suited for plotting a single data vector, but x-y plots of two data vectors with equal length are also possible. The Plot types list offers the following choices for the plot presentation:
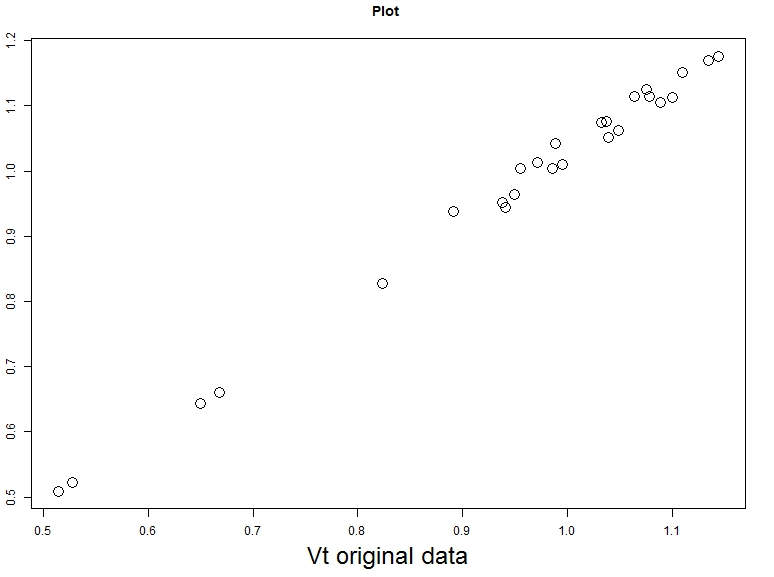
Some example plots: points plot with two variables A and B. Note that regression fits are not supported in this function.
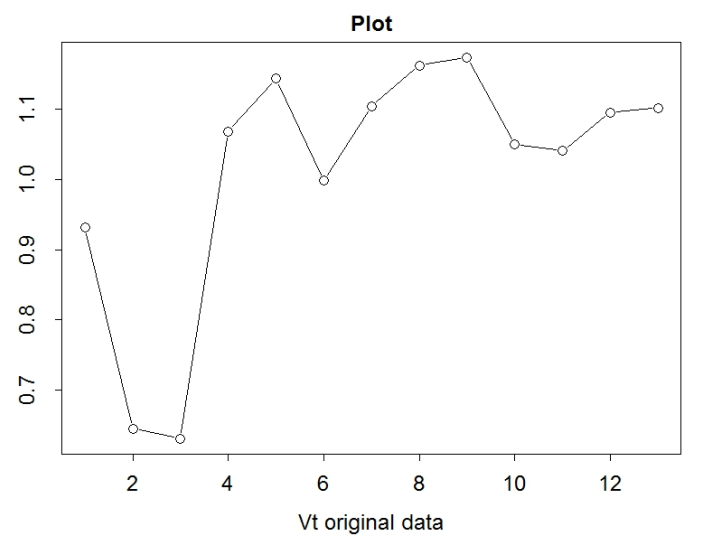
Points + lines plot with a single data vector
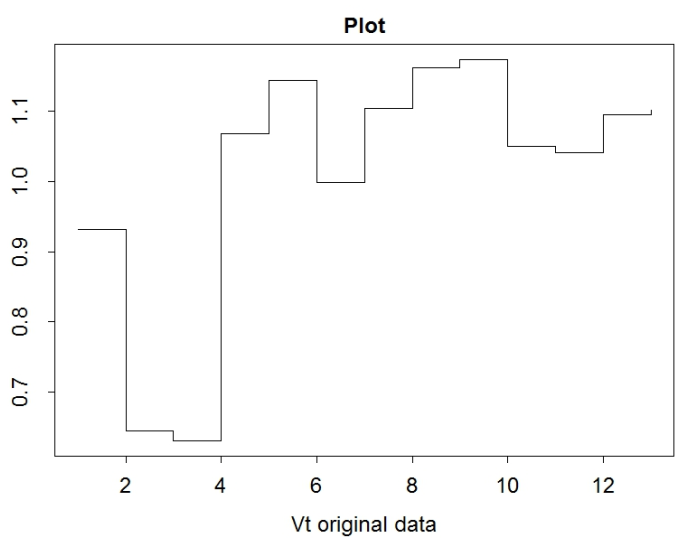
Steps plot with a single data vector