The user interface of the R console has some framework operations, a main part and a taskbar to the right.
Framework
There are some convenience buttons at the top of the window:
|
Buttons to minimize/maximize the R console window. |
|
Captures the entire screen (not only the PMOD window) and adds it to a console buffer. |
|
Opens the Console dialog window for checking the log output and reporting problems to support@pmod.com. |
|
Open help window. |
|
Button for opening the R server configuration window. |
|
Button for reconnecting to the R server, if a connection problem occurred. |
|
Dividers between different parts of the layout allow extending/shrinking the respective areas. |
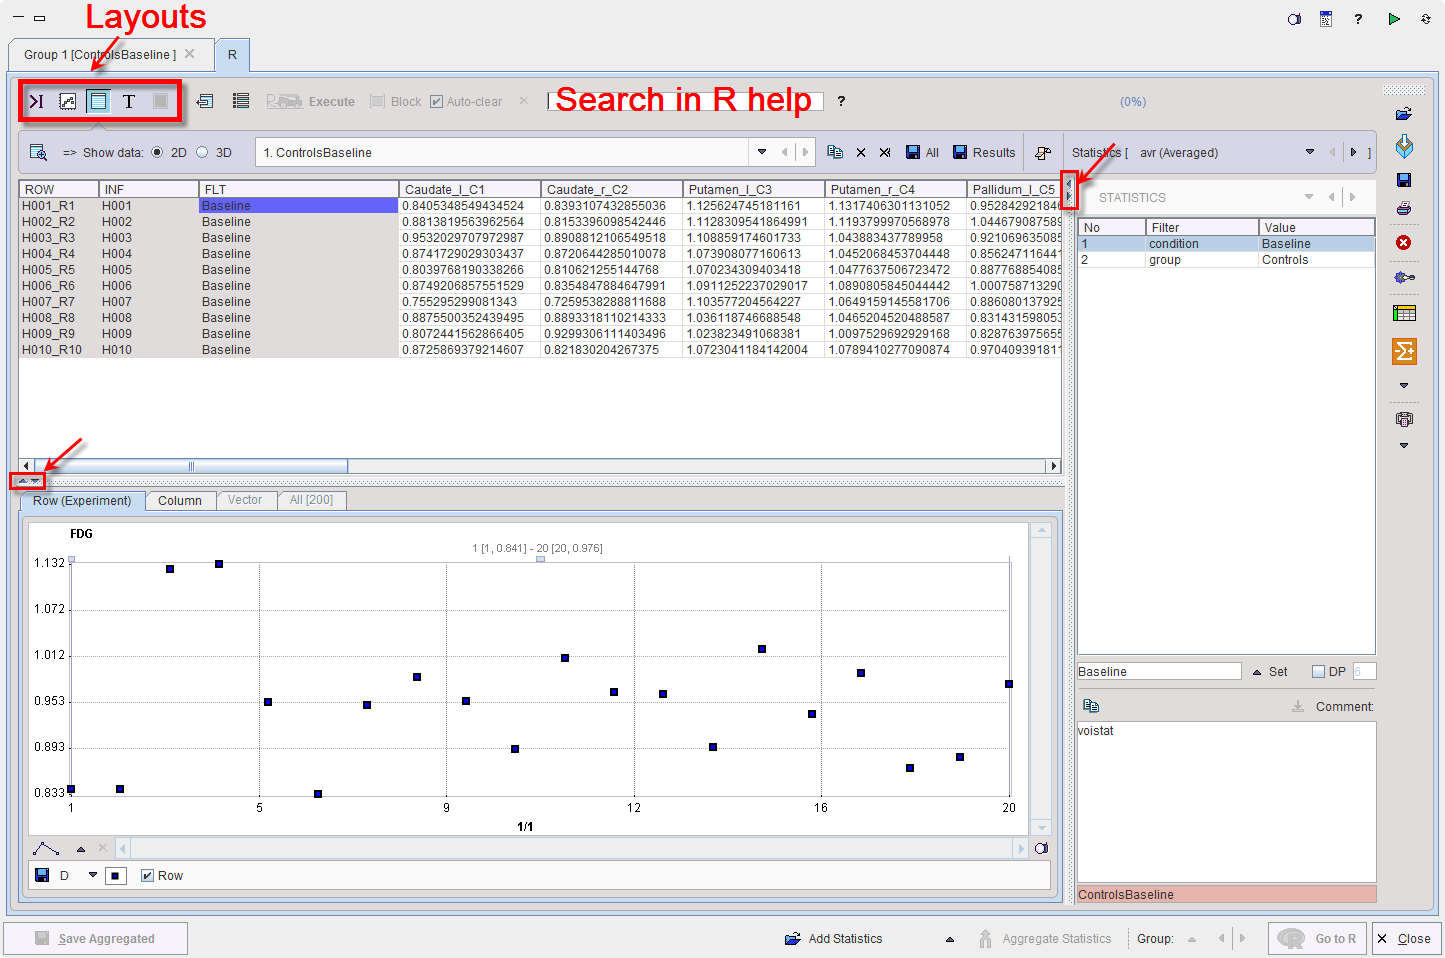
Main Window Layouts
The main statistics part has 5 different layouts depending on selection in the upper left:
|
Command layout: Allows invoking existing analysis scripts as well as editing and executing native R commands on the loaded data. |
|
Plotting layout: Allows producing different plots of the data, and inspecting the plots produced by analysis scripts. |
|
Table layout: Allows inspecting the data variables of the R workspace. Initially, the loaded data appear as variables g1, g2, etc. Scripts add variables to the workspace. Data can be copied to the clipboard for external usage. |
|
Text layout: Allows extracting the contents of numerical variables into a text field. |
|
Image layout: Allows visualizing images. Is only active after image data have been transferred. |
Next to the layout buttons is an area containing several buttons
![]()
which are related to programming in R and effective in different contexts:
|
Generates R code for extracting parts of the workspace variables. |
|
Lists the variables in the workspace and inserts the selected variable into the command line. |
|
Executes the whole code in the command window. |
|
Executes the selected code in the command window. |
|
Clears the contents of the command window after execution. |
Lateral Taskbar
The elements in the taskbar have the following functionality:
|
▪Loading of information as described below. |
|
Input files can be dragged to this box for opening them |
|
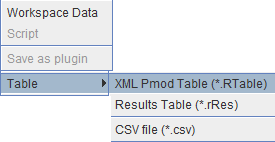
Saving of ▪the contents of the command window in two ways: as a new Script , which can be loaded, or as a plugin, which can directly be selected from a list; ▪all data variables as an R workspace (Workspace Data, .RData file) which can be loaded back into the PMOD R console, but also directly to R or other graphical front-ends of R (e.g. R Studio). ▪matrices can be saved as Table CSV files. |
|
Printing a report which may include plots, tables and/or images, depending on the analysis performed. |
|
Clears all the variables in the R workspace. |
|
Opens the configuration settings window:
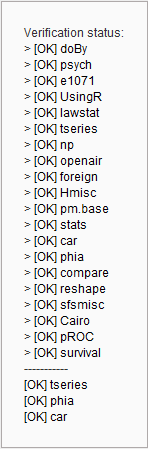
If user scripts require additional R packages, they can be typed into the Additional packages ... window and checked with the Verify ... button.
Tools location is layout option. The tools section may be arranged at the Top (as in this documentation), or at the Bottom. Initial Workspace Data directs the R console to load an R workspace file whenever it is started. This file might include R functions developed by the user. |
|
Opens the Console dialog window for checking the log output and reporting problems to support@pmod.com. |
|
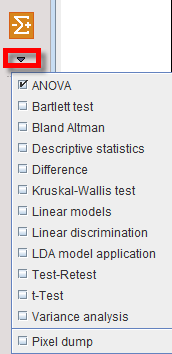
Shortcut for opening the scripts selection. System scripts are listed first, followed by scripts which were saved as plugins.
|
|
Opens the aggregation window for compiling individual statistics into an aggregate table. |