Note that if Linearity corr is enabled there are two choices:
![]()
During the TAC calculation, a corresponding dialog window will open .
T1 Images
With the first T1 images choice an image selection window opens. The user has to select the T1 scan which corresponds to the perfusion data set being analyzed, eg. T1 STRESS. PCARDM will load the images, interpolate them to the geometry of the perfusion scan and then show them in a window as illustrated below. A mask of the myocardium and the LV derived from the segmentation are shown in the overlay. It is the task of the user to shift the mask by dragging the handle such that it fits to the anatomy as illustrated below.
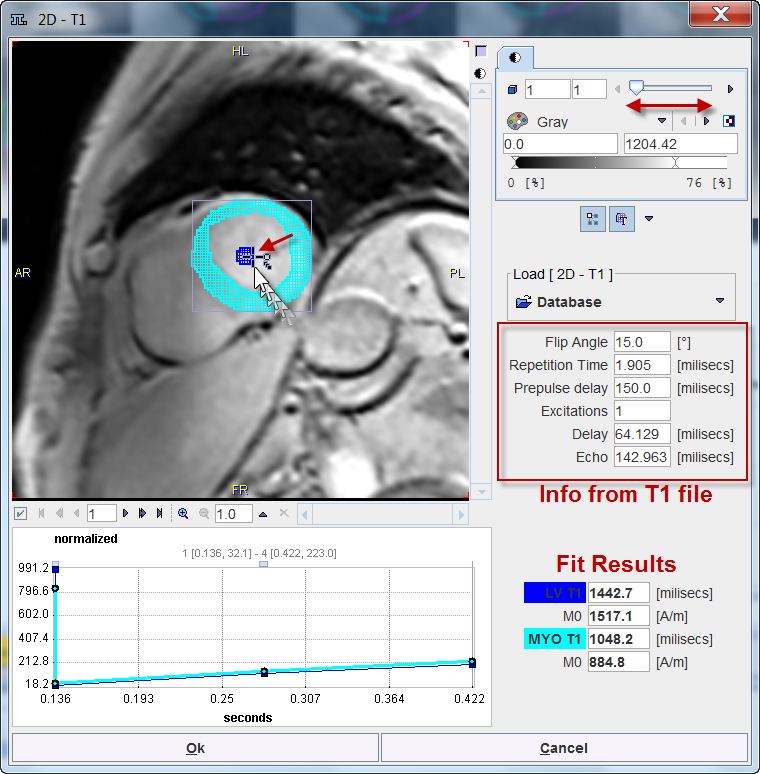
The program reads sequence parameters from the T1 scan file and uses them for fitting an average T1 time for the left ventricle (LV T1) and the myocardium (MYO T1) from the recovery of the magnetization. These values are shown in the fit results section. LV T1 will be used for correcting the LV TAC, and MYO T1 for correcting all segmental TACs.
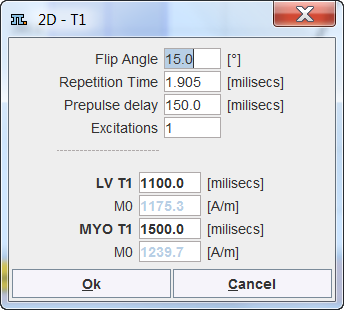
No T1 Images
If no T1 images are available the relevant information can be manually entered into a dialog window.
Correction Procedure
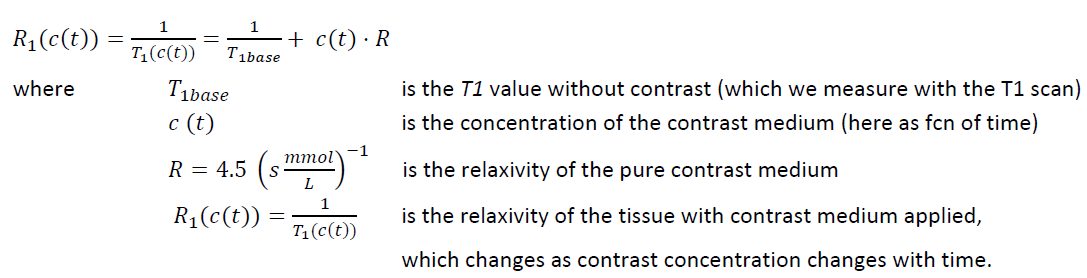
In principle the relaxivity R1 is first calculated [4]:
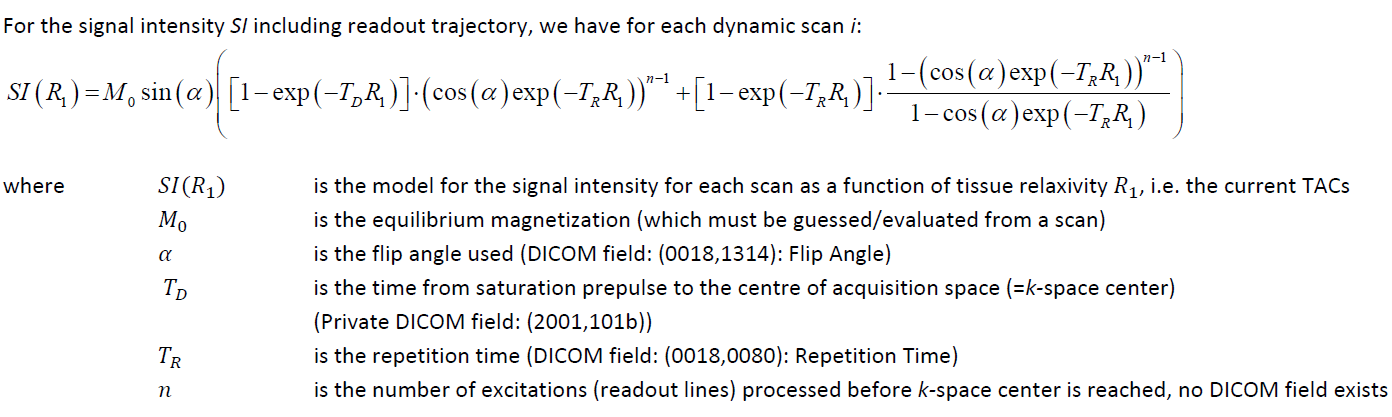
R1 is then applied for the conversion from MR signal to contrast agent concentration by [4]: