Processing a dynamic myocardial study with PCARDP consists of the following steps:
1.Configuration of the appropriate kinetic model and the segment model of the myocardium.
2.Loading of the dynamic studies. If data was acquired in different conditions (Rest/Stress), they can be loaded in a single operation.
3.Generation of anatomical images showing the myocardium and the blood volume as clearly as possible. This is achieved by averaging appropriate frames as described in the section Generation of Blood Volume and Myocardium Images.
4.Determination of the left ventricular long axis to bring the data sets into standard short axis orientation, as described in Standard Reorientation of the Heart. An automatic procedure is available. If it fails, the orientation must be manually adjusted by the user.
5.Definition of the volumes-of-interest (VOI) in the short axis view. The VOIs are required to calculate the TACs of the right ventricle, the left ventricle, and the different myocardium segments. An automatic procedure is available. If it fails, the VOIs must be manually corrected or outlined by the user.
6.Calculation of the time-activity curves. The number of myocardial TACs depends on the selected segment model (see Myocardium Segment Models).
7.Transfer of the TACs to the kinetic modeling tool. The LV TAC serves as the input curve, the RV TAC is applied for spillover correction in the septal segments, and the myocardium TACs are fitted with the selected model (see Kinetic Models). The result is a set of model parameters for each TAC.
8.The result parameters are returned to the cardiac tool for the assembly of the results. They are displayed as polar plots, and compiled into report pages.
9.If one of the ammonia tracers is applied, a parametric MBF map is additionally calculated using a basis function method.
10.Different types of reports can be generated and printed.
11.A normal database can be compiled from the results of normal volunteers. It can be used to find and quantify the deviations found in subject studies.
Note: These steps are performed for all flow studies, except if the factor analysis methodology is applied to water studies. In that case, different preprocessing steps are applied which are described separately in Pre-Processing Steps with Factor Analysis (Water only) .
Automatic Procedures
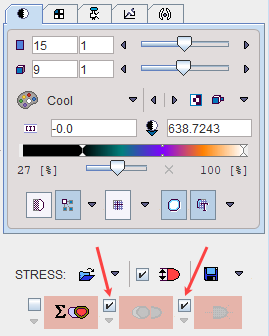
On the Reorientation page there are check boxes for enabling automatic procedures as described below. They are located to the left of the red action buttons:
|
Button to start the cropping/averaging process for calculating the BLOOD (average of some early frames while the tracer arrives in the left and right ventricles) and the MYOCARDIUM images. |
|
Button to start detection of the Short Axis (SA) orientation based on the BLOOD and the MYOCARDIUM images. |
|
Button to start detection of the myocardial centerline or the epi/endo boundaries. This is done by fitting a smooth model of the left ventricle (LV) shape to the MYOCARDIUM image and adjusting locally to the uptake pattern. The results are shown as contour lines in the SA images. |
The recommended setting is enabling the automatic boxes of the SA reorientation and myocardium contouring. In this way the procedures will run, whenever the time averaging definition is changed.