The Compare button on the GATED Analysis page starts the result comparison and shows it on the Compare page.

The page is organized in four main areas described below.
Time-Volume Curves Area
The volume curves of the left ventricle at STRESS and REST are shown in the upper left corner as a function of the gate bin.
Tables Area
The results of the gated analysis are summarized in four tables accessible via the tabs:
Results |
All functional parameters are listed in this table as described in the Heart Function Results section. Additionally, three parameters are available which compare STRESS and REST. |
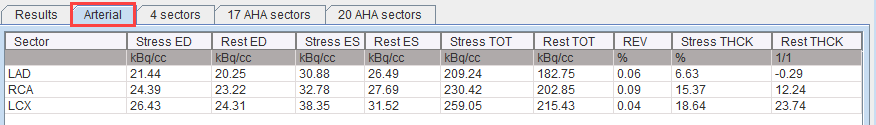
Arterial |
This tab shows the uptake related results averaged in the vascular territories LAD, RCA and LCX.
|
4 sectors |
This tab shows the uptake related results averaged in the Anterior, Septal, Inferior and Lateral sectors as well as an Apical average. |
17 AHA sectors |
This tab shows the uptake related results averaged in the sectors of the AHA 17 segment model. |
20 AHA sectors |
This tab shows the uptake related results averaged in the sectors of the AHA 20 segment model. |
Polar Maps Areas
The lower left shows polar maps of STRESS and REST uptake at systole and diastole. The two larger polar plots can be configured to show any of the following 8 results:
STRESS DIASTOLE |
Uptake of the STRESS scan at the end of diastole. |
REST DIASTOLE |
Uptake of the REST scan at the end of diastole. |
STRESS SYSTOLE |
Uptake of the STRESS scan at the end of systole. |
REST SYSTOLE |
Uptake of the REST scan at the end of systole. |
STRESS TOTAL |
Average uptake of the STRESS scan across the polar plots of all gates. |
REST TOTAL |
Average uptake of the REST scan across the polar plots of all gates. |
STRESS WALL THICKENING |
Percentage wall thickening in the STRESS scan. |
REST WALL THICKENING |
Percentage wall thickening in the REST scan. |
REVERSIBILITY |
Difference of the REST TOTAL and STRESS TOTAL polar plots after normalizing them to 1. |
Rest/Stress Summary Report
The Compare Report button compiles the Stress/Rest information into a report of four pages, which can be selected in Pages area. The first page contains the Results tab content in the upper section and the time/volume curves of the STRESS and REST gated studies.

The second page content consist of polar maps of the STRESS and REST uptake at the end of the systole and diastole, the third and fourth contain the tabular information from the various segmentation models.
Saving and Inspecting Numeric Results
The numeric information of the Results tab can also be saved or appended to a text file using the Save Results and the Append Results buttons, respectively. The saved file receives a .pcardRes suffix and can be visualized in Excel or a text editor (e.g Notepad).
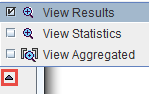
Two different numeric results can be opened and compared using View Results from the taskbar.
A dialog windows opens for selecting the first result file, and the data are shown in the left side of the appearing window.

The Load button in the upper right allows loading a second result for a side-by-side comparison. The Close button exits the comparison window.