The best way to prepare the data of interest is arranging them on the Comparison main page in a three-row layout, and then activating the Bland-Altman Plot selection with the black down arrow located under the ![]() icon in the lateral taskbar:
icon in the lateral taskbar:
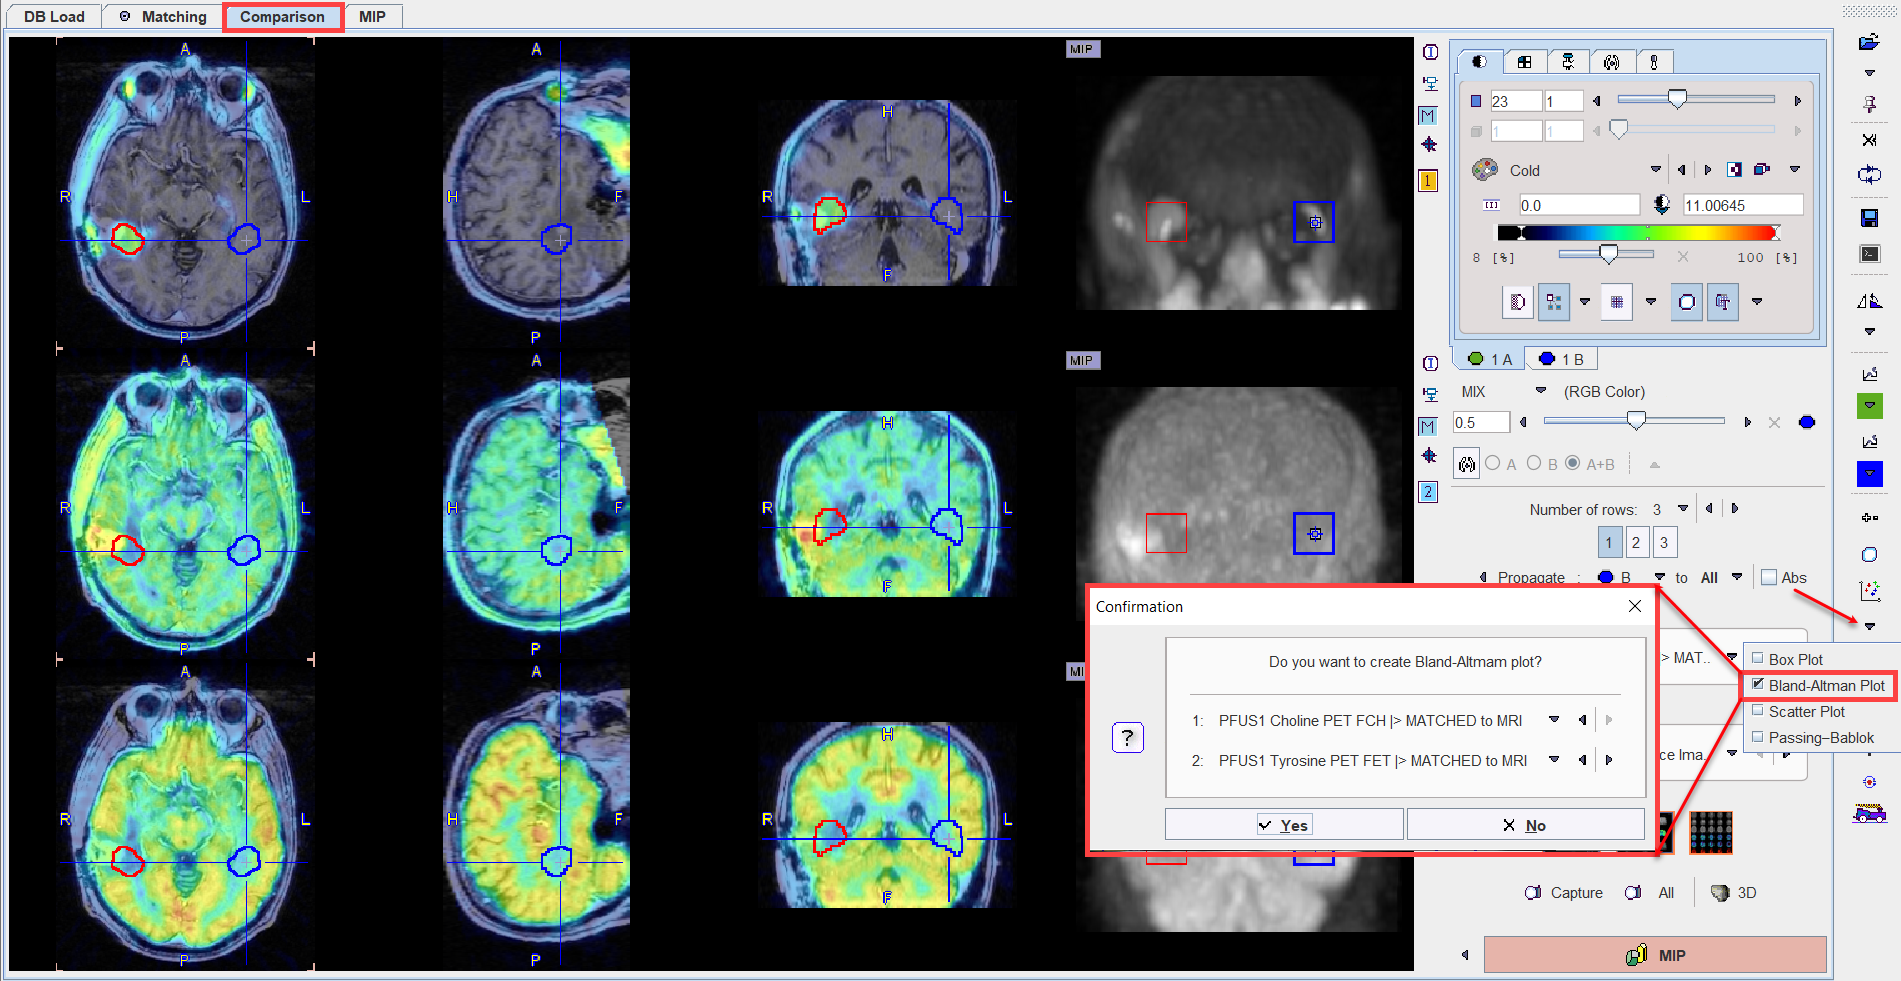
A dialog window is shown for configuring the 2 image series for which the result will be shown. If the series selection is not yet proper, it can be corrected before proceeding.
The plot requires VOIs to exist in the first series. If this is not the case, a dialog window appears:
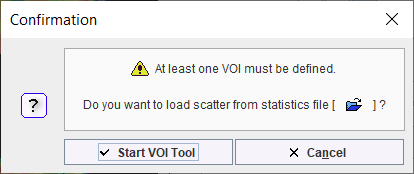
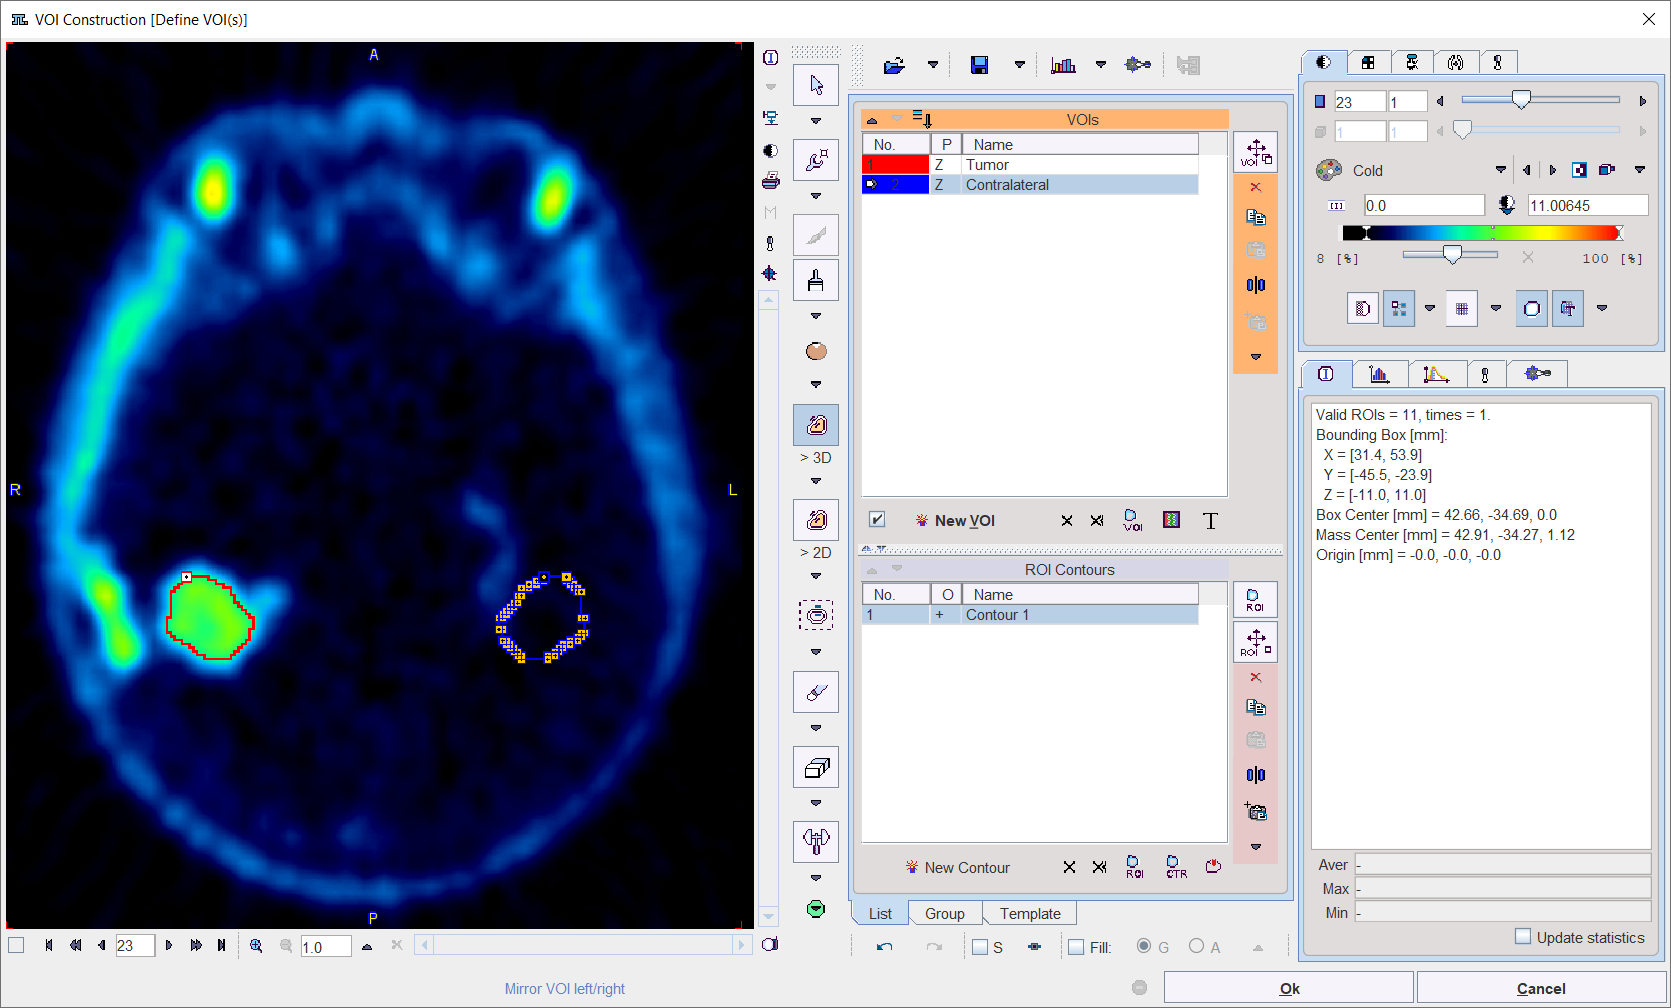
and Start VOI Tool used to enter VOI definition. The usual PMOD functionality can be applied for defining a list of VOIs.
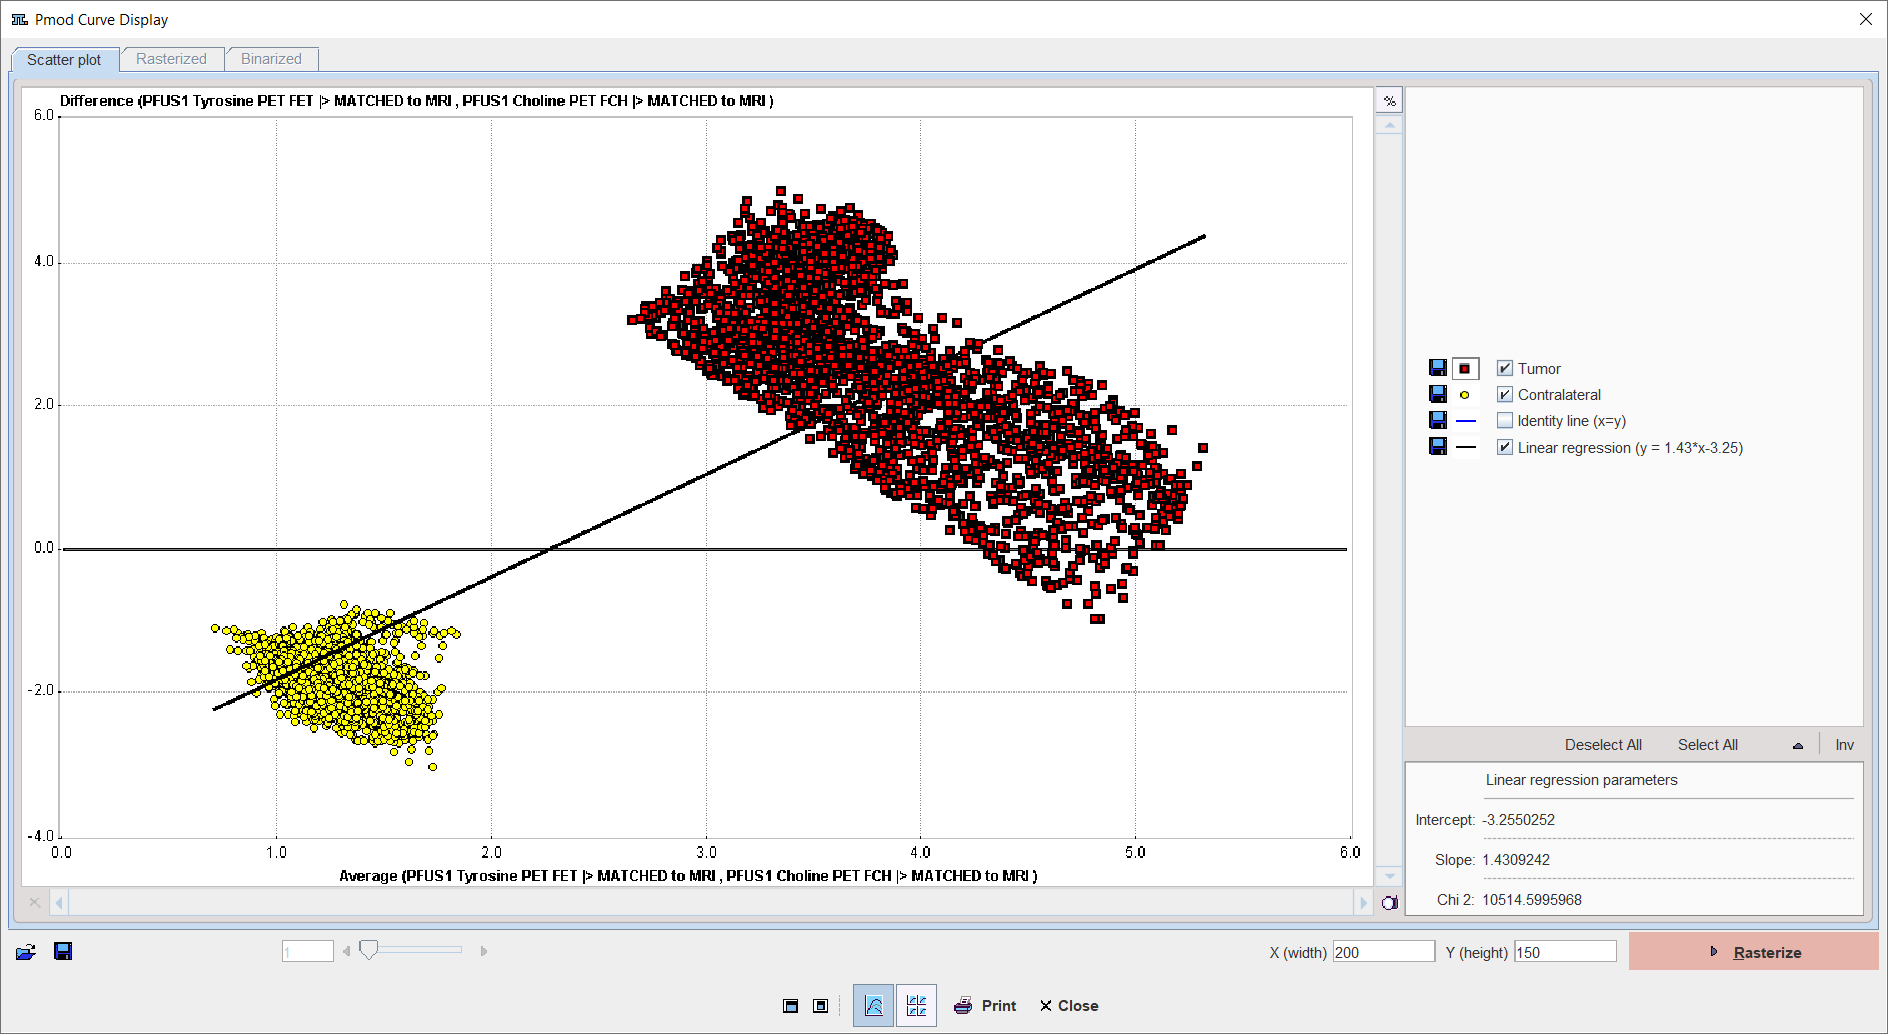
After confirming with Ok, the plot is generated.
The Bland-Altman plot can be used for a quick method comparison. For each VOI pixel it calculates the average and the difference across the images in the upper two rows, and plots the result (average on horizontal axis, difference on vertical axis).