The standard normalization template can be loaded with the button indicated below. A list will be shown, which corresponds to the selected species.
HUMAN Normalization Templates
The following brain templates are provided for the HUMAN species.
PET |
PET template provided with SPM5 (Statistical Parametric Mapping). It was constructed by Friston et al. at the Wellcome Department of Cognitive Neurology (University College London, UK) using Oxygen-15 water PET images of 12 normal subjects scanned in resting condition with eyes closed. The template is in MNI (Montreal Neurological Institute) coordinates. |
MR T1 |
T1 template provided with SPM5. The image was derived from the ICBM152 image which represents the average of 152 healthy T1 brain images by reducing it to 2mm isotropic resolution and smoothing with an 8mm FWHM Gaussian filter. The original ICBM152 data originates from Alan Evans, MNI, Canada (ICBM, NIH P-20 project, Principal Investigator John Mazziotta). |
MR T2 |
The same as the T1 above, but with the T2 MR images. |
SPECT |
SPECT template provided with SPM5. It was created by Leighton Barnden et al from the Department of Nuclear Medicine at the Queen Elizabeth Hospital in Adelaide 22 normal female subjects. Each was scanned after injection of Tc-99m HMPAO on a triple head camera with ultra-high resolution fanbeam collimators. |
MR T1 |
As the T1 above, but with the skull part of the image removed. |
MR T2 |
As the T2 above, but with the skull part of the image removed. |
CT |
CT template for an older population created from 30 healthy individuals with ages similar to what is commonly seen in stroke (mean 65 years). Developed for the SPM8 Clinical Toolbox by Rorden et al [10]. |
CT CU |
CT template as above but with the converted units (CU) which improves the contrast for soft tissue and CSF so that the normalization procedure works better. Conversion procedure : HU values -1000..-100 are mapped to 0..900, values from -99..100 are linearly scaled to the range 911...3100, and values i>100 become [i+3000] [10]. CT images to be normalized with this template must also be converted by enabling the Apply CT scaling option. |
The amyloid tracers, e.g. AV45, have different pattern distribution as compared to the SPM5 Oxygen-15 water PET template. When such images data are analyzed the PET based normalization will not work. Therefore, we created group specific (AV45 Controls and AV45 AD) AV45 PET templates using ADNI data. The description of the template methodology is available for direct download. The same methodology was used to create group specific FDG PET templates using FDG images available via ADNI repository database.
PRIMATE Normalization Templates
The following brain templates are provided for the PRIMATE species.
![]()
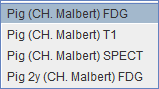
PIG Normalization template
The following templates are provided for the PIG species:
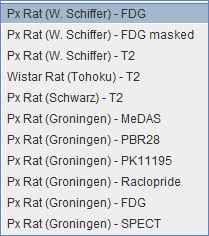
RAT Normalization Templates
The following brain templates are listed for the RAT species.
MOUSE Normalization Templates
The following brain templates are listed for the MOUSE species.
![]()