In the following, the compartment models are illustrated using a tracer that is injected intravenously as a bolus and is not freely diffusible. Please refer to the consensus paper of Innis et al [56] for the details of the nomenclature and the interpretation of the models in the context of brain receptor tracers.
When the tracer arrives in the heart chambers, it is well mixed with blood and distributed by the arterial circulation. It finally arrives at the capillary bed where exchange with the tissue can take place. Some fraction of the tracer is extracted into tissue and metabolized, the rest is transported back to the heart, from where a new circulation starts.
This simplified “physiologic” model can be translated into a 1-tissue compartment model (1TCM):
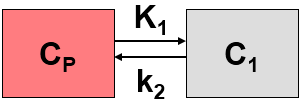
Because of mixing it is assumed that, the arterial tracer concentration is the same throughout the body, so that it can be measured in a peripheral artery. The tracer concentration in tissue C1(t) increases by the extraction of tracer from the arterial blood plasma. A usual condition for a quantitative analysis is, that only the unchanged tracer, called the authentic tracer or parent, can enter tissue, whereas labeled metabolites which may also circulate cannot. Because extraction is described by a first-order process, the transfer of material is proportional to the parent concentration CP(t). Parallel to the uptake, tracer in tissue is reduced by a backwards transfer (or washout), which is proportional to the concentration in tissue. Both processes compete, so that the change over time of the net tracer concentration in tissue (dC1(t)/dt) can be expressed by the following differential equation
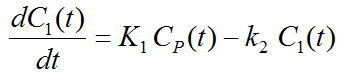
The two transfer coefficients, K1 and k2, have a somewhat different meaning, indicated by using capital and small letters. K1 includes a perfusion-dependent component and has units of milliliter per minute per milliliter tissue, whereas k2 [min–1] indicates the fraction of mass transferred per unit time. For example, if k2 equals 0.1[min–1], material leaves the tissue compartment at a rate of 10% per minute. The parent concentration CP(t) is not a compartment, but considered as a measured quantity and appears as the input curve driving the system.
The differential equation of the 1-tissue compartment model can be analytically solved (integrated), yielding the following equation for the concentration of tracer in tissue:
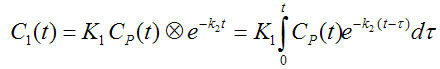
Hence the time course of the tissue concentration essentially results from a convolution ⊗ of the input curve with a decaying exponential. K1 acts as a scaling factor of the concentration course, whereas the washout coefficient k2 has an impact on its form.
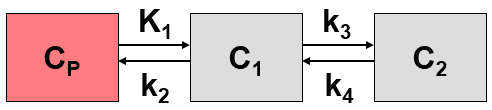
More complex compartment models distinguish different forms of tracer in tissue, which is usually interpreted as follows. After entering a cell, the tracer is available for binding in a free form at a concentration C1(t). Free tracer can directly be bound to its target molecule, C2(t), but it also may bind to some cell components that are not known in detail, C3(t). Considering these pathways, a 3-tissue compartment model (3TCM) with six transfer coefficients is established, whereby C2 and C3 communicate only by C1.
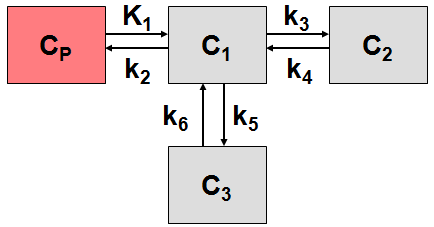
The system of differential equations can be derived in analogy to the 1-tissue compartment model, but is much more complex. The equations describing this model are given by
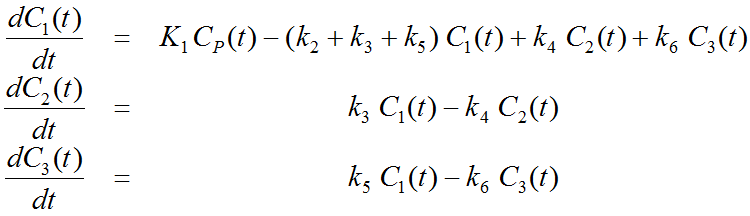
This system contains six unknown parameters (K1 to k6) that are difficult to assess experimentally. For practical purposes, the system is therefore most often reduced to a 2-tissue compartment model (2TCM) by treating free and non-specifically bound tracer as a single compartment C1 (non-displaceable compartment).
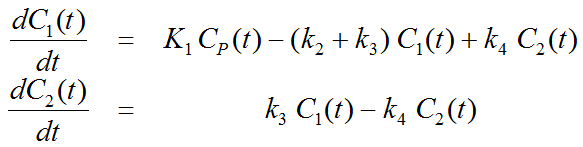
This simplification is justified if the exchange free ↔ nonspecific binding is significantly faster than the exchange free ↔ specific binding. Otherwise specific and nonspecific binding cannot be distinguished, and the resulting transfer coefficients cannot be attributed to specific binding alone. The simplified two-tissue compartment model is given by
By using a mathematical method called Laplace transformation, analytic solutions can be derived for linear multi-compartment models, but the mathematical formulas are complicated expressions already for two compartments. However, they demonstrate that generally K1 represents a scaling factor like in the solution given for the one-tissue compartment.
Model Simplification
While complex models are a more realistic description of the involved processes, they include many parameters. PET data from dynamic measurements has a limited statistical quality, and represents the summed contributions from all compartments. When trying to estimate a large number of model parameters from such data, the variance of the resulting parameters tends to be too high for reliable interpretation. Therefore, only relatively simple models with 2 to 4 (at most 6) parameters are feasible in practice.
When the 3-tissue compartment model is simplified to a 2-tissue compartment model, and further to a 1-tissue compartment model, the meaning of the transfer coefficients changes (except for K1). The “lumped” parameters of the simplified models can be expressed by the parameters of the complex models as shown in the tables below. Note that k2 and k3 have a different meaning in the different models, as well as C1.
Parameters in 1TCM |
Expressed by parameters of the 2TCM |
Expressed by parameters of the 3TCM |
K1 |
K1 |
K1 |
k2 |
|
|

Parameters in 2TCM |
Expressed by parameters of the 3TCM |
K1 |
K1 |
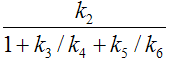
k2 |
|
k3 |
|
k4 |
k4 |


The term 1/(1+k5/k6) represents the free fraction of tracer in the non-displaceable tissue compartment which is available for transfer back to blood or for specific binding, and is often called f2.
A good summary on the configuration and interpretation of linear models for receptor tracers is given by Koeppe et al. [15]. Starting from the 3-tissue model it is nicely shown how the parameters of simplified models are related to the true rate constants. PKIN can take these relations into account when switching from a more complex model to a simpler one. This behavior can be switched on by the Model Conversion check on the Extras panel.
Relation of K1 with Perfusion
As mentioned earlier, K1 is related to tissue perfusion F. With a capillary model, the relation
K1 = EF
can be derived. E represents the unidirectional first-pass extraction fraction (i.e., the fraction of tracer that penetrates the capillary wall and is extracted into the tissue during the first pass of tracer through the capillary). The reverse transport is not regarded in the calculation of E. Renkin [40] and C. Crone [41] calculated the extraction as
E = 1 – e–PS/F
P denotes permeability, and S, the surface of the endothelium by which the capillary exchanges with the tissue. The relation demonstrates that the extraction depends on the properties of the endothelium with respect to the tracer (PS), as well as the perfusion F. The higher the perfusion, the smaller the extraction, because the average time spent close to the capillary wall decreases. However, total mass transport in general still increases with flow, as the reduced extraction is more than compensated by the higher abundance of tracer (F in the term EF). For tracers with very high permeability, the extraction is virtually independent of perfusion and E approaches 1 (such as for 15O-labeled water). In this case, K1 equals perfusion.
Volumes of Distribution for Receptor Tracers
For receptor tracers, it is important that the extraction from plasma to tissue is sufficient, such that the kinetics is not limited by the extraction step. Additionally, the relation of the transfer coefficients for specific and nonspecific binding determines whether these different types of binding can be distinguished.
Naturally, the main interest is in specific binding. Besides the individual rate constants k3 and k4, which are often difficult to estimate precisely, the distribution volume of specific binding VS is a measure which is often used to quantify specific binding. VS is defined by the ratio of specific binding concentration to total parent at equilibrium (which may not occur during the experiment). However, it can also be calculated from the rate constants of the 3-tissue compartment model as follows.
Vs = K1/k2*k3/k43-Tissue Compartment Model
Under the assumption of a rapid equilibration between the free and non-specific compartment the same expression with the rate constants from the 2-tissue compartment model is often used as an approximation of VS.
If the assumption of rapid equilibration is not justified one must resort to considering the entire tracer concentration in tissue as an indicator of specific binding. The measure used in these cases is called the "total distribution volume" VT. In general it is defined as the ratio of the tracer concentration in tissue to total parent in plasma at equilibrium. A VT equal to 20 hence means that the tracer is being concentrated in tissue by 20:1. VT can be easily computed from the rate constants of the compartments model.
VT = K1/k2 1-Tissue Compartment Model
VT = K1/k2 (1+k3/k4) 2-Tissue Compartment Model
K1/k2 can be interpreted as the distribution volume of the first tissue compartment C1. In receptor tracer experiments, this compartment is usually called the non-displaceable compartment, and K1/k2 the distribution volume VND of non-displaceable uptake,
VND = K1/k2 2-Tissue Compartment Model
This naming indicates that the concentration of free and non-specifically bound tracer in tissue is not reduced when a non-labeled ligand is brought into the tissue, competing with binding to the same receptor as the tracer. The rational for this assumption is that the potential for non-specific binding to various cell components is practically unlimited as compared to the number of specific binding sites.
Rate Constants and Binding Potential for Receptor Tracers
•k2 represents the fractional rate constant for the washout of free tracer from tissue to plasma. It it is a composite rate constant and is related to flow in the same way as K1. Consequently it is often reasonable to assume that the ratio K1/k2 is insensitive to flow and regionally constant. This property can be exploited as a restriction in a model fit, hereby reducing the number of fitted parameters.
•k3 is regarded as the rate of association of the ligand with the specific binding sites. It is a function of the concentrations of the free radioligand, the available binding sites and intrinsic second order association rate constants. Consequently it is a pseudo first order rate constant incorporating the concentration of available binding sites.
•k4 is considered as the dissociation rate constant of the receptor-ligand complex; often it is assumed to be invariant, what is still a matter of debate.
The binding potential (BP) quantifies the equilibrium concentration of specific binding as a ratio to some other reference concentration. Particularly, the ratio at equilibrium of specifically bound radioligand to that of non-displaceable radioligand in tissue is referring to as BPND (unitless) and equals the ratio k3/k4.