The 2-tissue compartment model for FDG has the same structure as the standard model.
Differential Equation of the Mass Balance
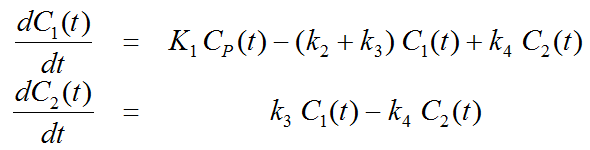
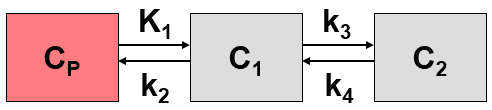
with FDG concentration of in arterial plasma Cp(t), FDG concentration C1(t) and phosphorylated FDG (FGD-6-P) concentration C2(t) in tissue. K1 [ml/ccm/min] and k2 [1/min] are the uptake and clearance rate constants, whereas k3 [1/min] represents phosphorylation by hexokinase and k4 [1/min] dephosphorylation.
Operational Model Curve

with the concentration CB(t) of tracer in whole blood, and the blood volume fraction vB.
Parameter Fitting
The model includes the 5 fitable parameters vB, K1, k2, k3, k4. Usually, vB is fixed at a physiologic value of 3-5% to reduce the number of fitted parameters, and dephosphorylation is so slow that k4 is fixed k4=0.
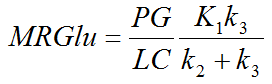
FDG-specific Results
The FDG model has two additional input parameters, the lumped constant (LC) and the plasma glucose concentration (PG [mmol/l]). In combination with the estimated K1, k2, and k3 parameters they allow calculating the metabolic rate of glucose MRGlu
Note that the LC and PG values are maintained when switching back and forth with the Patlak model, if the Model conversion option in the Extras panel is enabled.