This model was developed by Alpert et al. [1] to extend the concept of activation studies for including measurements targeting neurotransmitters and specific receptor populations. It uses the fact that cognitive activation increases neuronal firing rate, hereby increasing the endogenous neurotransmitter level and altering the kinetics of specifically bound radioligands. The methodology uses a single PET injection. The scan starts with an acquisition of the subject at rest (baseline), followed by an acquisition with the subject performing a task (activation). The data (after motion correction of the lengthy scan) is analyzed modeling the change of the endogenous neurotransmitter level as an effect which occurs immediately after the task onset, and diminishes exponentially over time. The method has been applied to [11C]raclopride [1] and more recently to [18F]fallypride data [2,3].
Note: The model has been called LSSRM [1,2] and LSRRM [3], but was renamed to LSRTM to correspond to the commonly used notation of the Simplified Reference Tissue Model SRTM.
Model Configuration and Assumptions
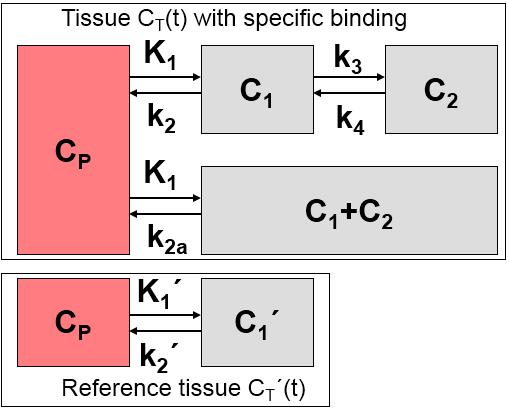
The model uses the same assumptions as the Simplified Reference Tissue Model (SRTM):
1.A reference tissue devoid of receptors exists which can be modeled by a single-tissue compartment model.
2.The distribution volume is the same for the tissue of interest and the reference tissue: K1/k2=K1'/k2'.
3.The kinetics in the receptor-rich tissue of interest is such that it is difficult to distinguish between the specific and the non-displaceable compartment; ie. the tissue TAC can be fitted by a 1-tissue compartment model with an apparent uptake rate constant k2a = k2/(1+BPND).
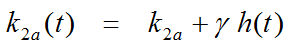
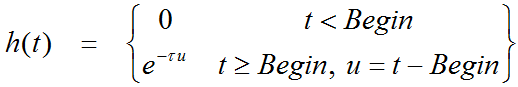
Additionally, it is assumed that at the onset of the activation, k2a is increased by the amplitude γ of ligand displacement, and that the effect dies away with a decay constant τ. This behavior is described by a time-dependent k2a as follows:
Operational Model Curve
Defining the ratio of tracer delivery R1 as K1/K1', the following operational equation can be derived for the measured tissue TAC in a receptor-rich region:
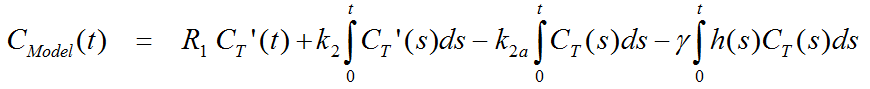
From the parameters in the equation the binding potential BPND can be calculated as
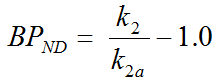
The main outcome of the model, however, is the amplitude γ of ligand displacement, for which a t-score value and its p-value for a one-tailed t-test are also provided.
Parameter Fitting
The user has to define the Activation start time with the corresponding input parameter. The Resampling parameter defines the interpolation grid for the exponential convolution, which corresponds to the last integral term in the operational equation.
The parameters of the non-linear fitting procedure include R1, k2, k2a, gamma and tau. To reduce the number of fitted parameters tau is usually fixed at a value of 0.03min-1 (~23min half-life). From the fit parameters, BPnd is calculated as well as the t-score and the p-value of gamma.
References
1.Alpert NM, Badgaiyan RD, Livni E, Fischman AJ. A novel method for noninvasive detection of neuromodulatory changes in specific neurotransmitter systems. Neuroimage. 2003;19(3):1049-60. DOI
2.Christian BT, Lehrer DS, Shi B, Narayanan TK, Strohmeyer PS, Buchsbaum MS, Mantil JC. Measuring dopamine neuromodulation in the thalamus: using [F-18]fallypride PET to study dopamine release during a spatial attention task. Neuroimage. 2006;31(1):139-52. DOI
3.Ceccarini J, Vrieze E, Koole M, Muylle T, Bormans G, Claes S, Van Laere K. Optimized in vivo detection of dopamine release using 18F-fallypride PET. J Nucl Med. 2012;53(10):1565-72. DOI