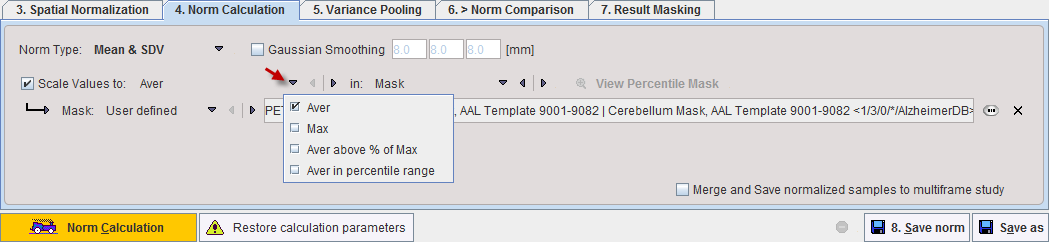
The database properties are defined on the 4. Norm Calculation tab.
A Gaussian smoothing filter is available for smoothing the normalized control images before the database calculations. However, as the pooling of controls also has a smoothing effect, the filter should be set moderately.
In order to perform a pooled analysis it is required that the control images have comparable pixel values. In most cases the image values must therefore be scaled. This is achieved by dividing the pixel values by the average value in a stable reference tissue. Several user interface elements in the Scale Values to line allow flexible scaling strategies. The first selection lets define how the reference value is calculated within a spatial domain defined by the second selection. The calculation choices are:
Aver |
Average value in the reference pixels. |
Max |
Maximal value in the reference pixels. |
Aver above % of Max |
Average of those pixels which are above the entered percentage of the maximum. |
Aver in percentile range |
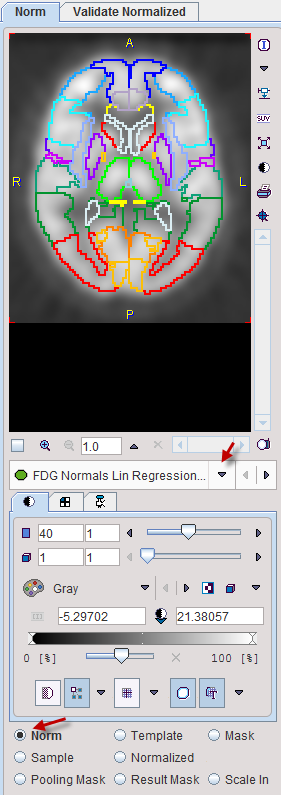
A pixel value histogram is calculated, and the average value in the specified percentile range calculated. The setting in the example above only considers grey matter pixels which are in the 40% to 90% percentile range. This may represent an approach for excluding diseased hypometabolic (low values) and activated (highest values) pixels. The View Percentile Mask provides a visualization of the pixels which are used for calculating the reference value. As soon as it is activated, the currently selected sample is analyzed and the pixels shown which qualify for the criterion. |
The spatial domain choices are:
VOI |
A volume-of-interest which can be selected in the database. |
Mask |
A binary mask file which can be selected in the database. |
Normalized Sample |
No restriction, all data pixels are used. |
Finally, the database needs to be calculated with the Norm Calculation button. The following processing steps are performed:
1.For each normalized control sample the reference value is calculated, and all pixels values are divided by it. The resulting normalized values typically range from 0 to somewhat above 1.
2.The scaled images are smoothed with the Gaussian filter.
3.For each pixel the distribution of the scaled values is calculated in all control samples.
As a result, the average value (representing the expected normal value) and the standard deviation (a measure of uncertainty) are known per pixel. These results are saved in the database as new image series of the normalization template study and marked in the description as MEAN and STDV.
If the Merge and Save normalized samples to multiframe study is enabled, all normalized control images are arranged in a dynamic series and saved in the database when the Norm calculation completes. This allows for a simple export of the data for other purposes.
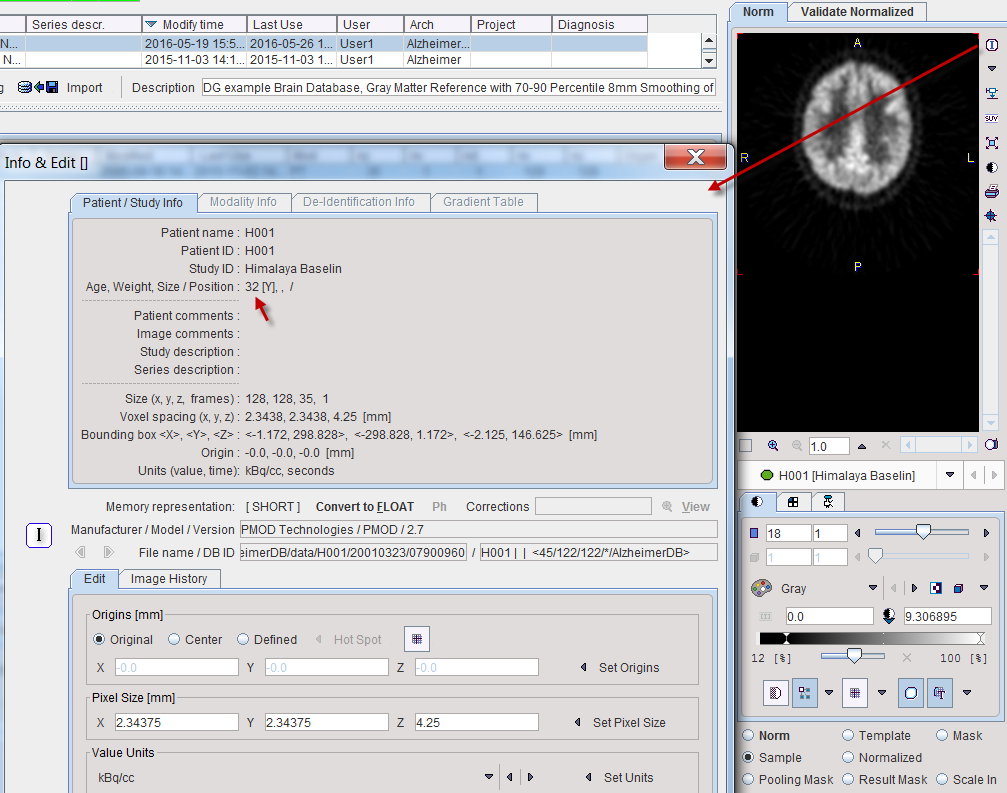
Age Regression
If the image pattern is dependent on the age of the controls, the Norm Type can switched to Linear Regression. Note that it is required that the age of the subject is available in the data. This can be inspected as illustrated below. If it is not encoded as age in the data, the age is calculated as the difference between birthdate and scan date.
The result of a norm calculation with age regression is a linear regression at each pixel. It can be inspected by selecting Norm in the preview window and is presented as a dynamic series with the y-intercept as the first frame an the slope as the second frame. When applying an age-regression norm, the normal pattern at the subject age will be calculated and compared with the subject image.