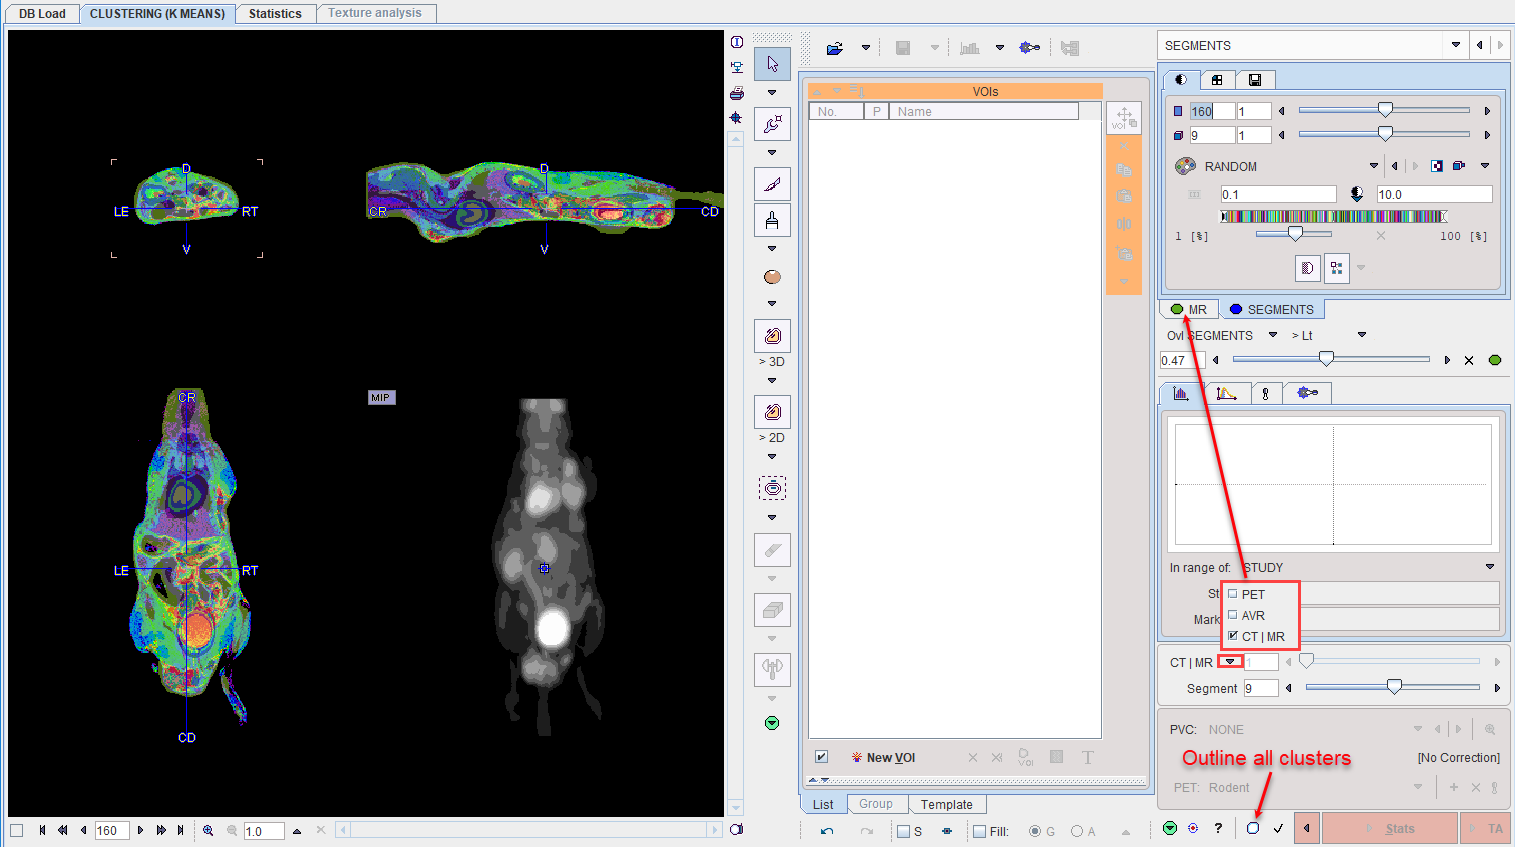
The display on the SEGMENTS panel shows a fusion of the segmentation result SEGMENTS with either the PET or the anatomical image as the reference.
The display below shows a fusion of the segmentation result (SEGMENTS) with the PET image as the reference:
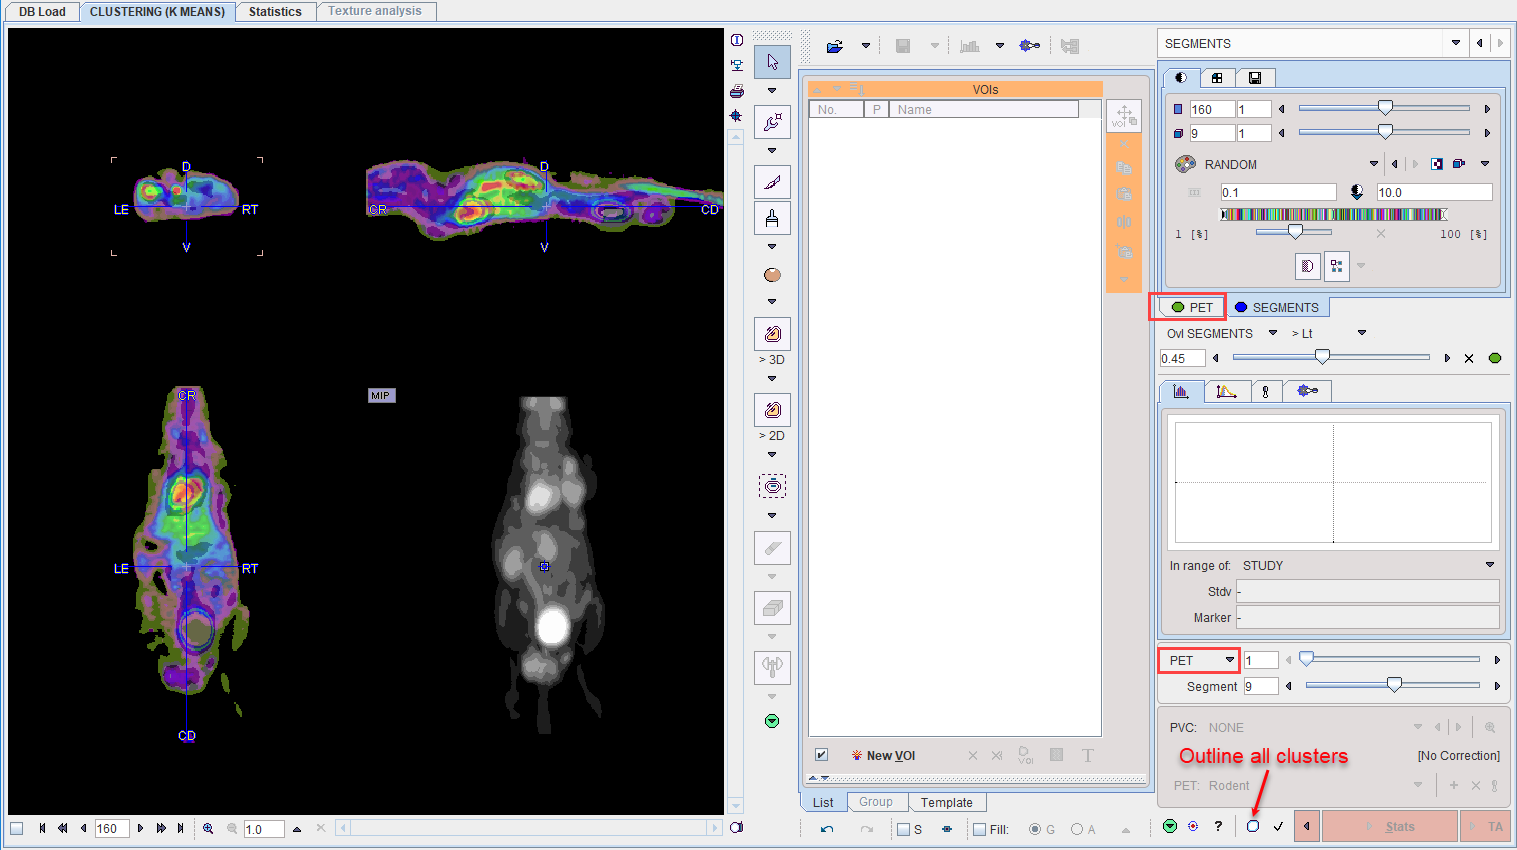
The procedures for convert converting cluster into VOIs are the same as for the ORGAN SEGMENTATION, except that the clustering only provides a single decomposition of the volume. Correspondingly, there is a static label images in the SEGMENTS tab rather than a dynamic series showing the volume in a hierarchical structure of decompositions, and the Segment slider is inactive. All clusters can be outlined at once using the Outline Maps button, as indicated above.
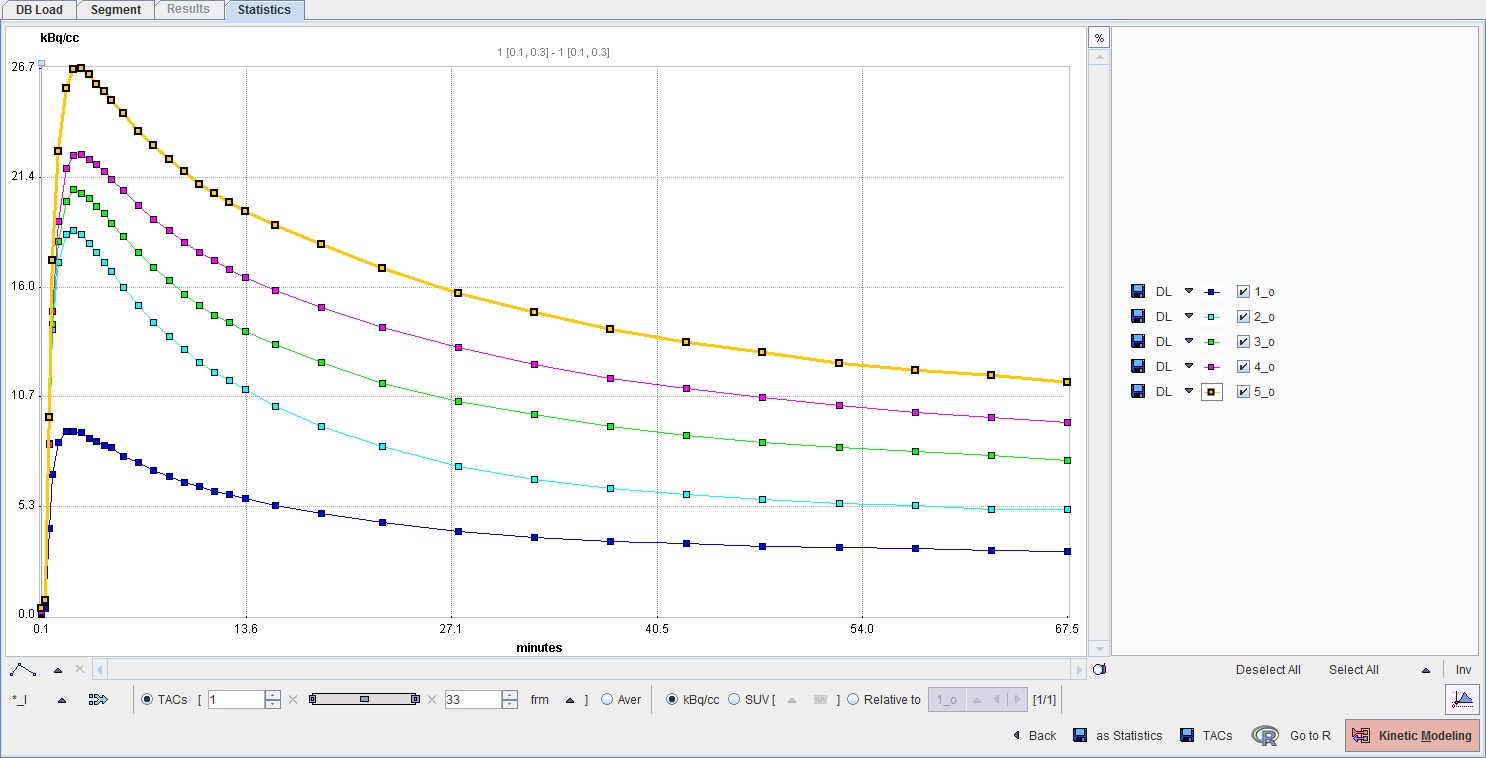
Finally, Statistics will calculate the average TACs of the clusters and show them on the Statistics page.