Starting the PSEG Tool
The PSEG tool is started with the Segment button
![]()
from the PMOD ToolBox or by directly dragging image files onto the above button.
Organization of the PSEG User Interface
The user interface of PSEG consists of four pages which can be selected by tabs:
![]()
1.DB Load page: Loading of the images from a PMOD database. The images are transferred to the processing page according to their modality. This page is not shown if the database functionality is disabled.
2.Segmentation page named according to the selected workflow, in the example above PERCIST: Main segmentation page for creating VOIs by automatic and manual methods. The workflows are organized as a sequence of panels within this page.
3.Result page named according to the selected workflow, in the example above PERCIST Report: Whereas the segmentation results in a set of VOIs, the evaluation results withing these VOIs are shown on the result page.
4.Texture analysis page: PSEG supports the calculation of texture indexes within the result VOIs, which are shown on this page.
Step-Wise Processing
Segmentation is consistently organized as a stepwise progression within the segmentation page. Each stage is represented by a panel, which can be selected in the upper right.

On each panel the user has to take some action such as data loading or parameter configuration, and then start the next processing step with the red action button located in the lower right, for example.
![]()
As soon as the result has been calculated, it is shown on the subsequent panel representing the new processing stage.
By selecting the processing panels with the down arrow, results of prior stages can be inspected without initiating any calculations. To repeat a calculation with modified parameters, please progress by activating the action button in the lower right again.
Fusion Image Display
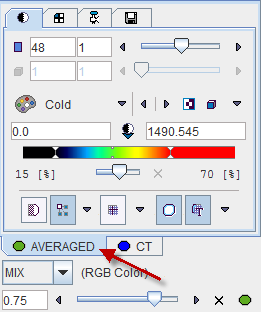
The content of the image display area is controlled in the upper right. Often, more than one image contribute to the display. In these cases the tab corresponding to an image has to be first activated, before its color table or the color thresholds can be modified.

The fusion control section is located below the image control tabs. In the illustration above the colors of both images are mixed, whereby the weighting can be changed with the slider.
Convenience Buttons
Next to the action button in the lower right is an area with three buttons
![]()
offering the following functions:
|
Hide the parameters panel to free some space in the user interface. With the panel hidden, the icon changes to |
|
Reset the parameters on the page to their default values. If this button in the taskbar to the right is activated, the defaults are reset on all pages. |
|
Display help information for the current page. |
Configurations
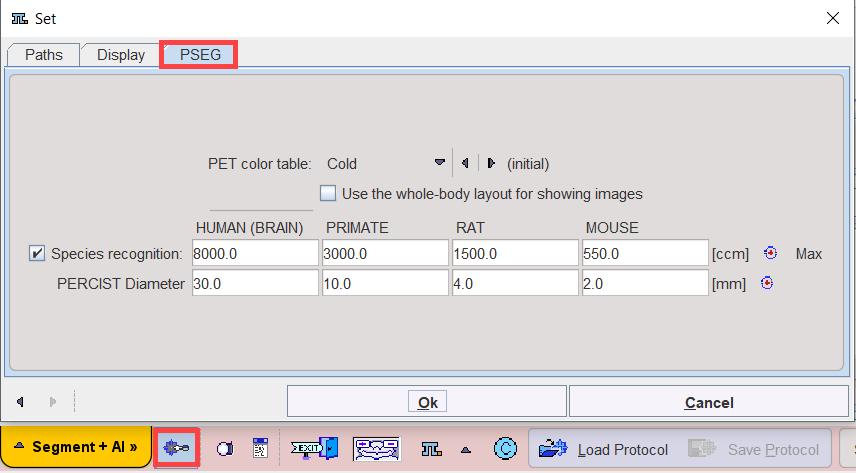
The PSEG tool can be configured according to user preferences in a dialog window as illustrated below.

The common configurations are available on the Paths and Display tabs, and in the upper part of the PSEG tab.
The Use the whole-body layout for showing images option allows configuring the whole-body layout in the view port for oncology users
If the Species recognition box is enabled, PSEG determines the imaged species based on the volume of the loaded data. The qualifying species volumes can be edited to tailor the behavior, if needed. The PERCIST methodology uses the uptake in a reference sphere for calculation of a contouring threshold. PERCIST Diameter allows configuring the sphere diameter for the different species.
Further Information
This guide is focused on the segmentation functionality. Please refer to the PMOD Base Functionality Guide for details about general functions such as data loading, image display and VOI definition.