The system maintains a history of model configurations for each region. All operations, which change the model configuration result in a new entry in the history list. The history is saved within a .km file and will be continued after reloading the data.
The history functionality is accessible by the user interface elements right to the model configuration

|
Switches to the previous model configuration in the history list. |
|
Appends the current model configuration to the list. |
|
Switches to the following model configuration in the list. |
|
Shows the history window. |


CAUTION: This history mechanism does not account for changes in the configuration of the blood-related models, except for the blood delay. However, it includes the definition of the residual weighting, the valid points, and the tissue TAC values.
History Window (PKIN Parameters Explorer)
The history list is shown in the PKIN parameters explorer window as illustrated below. It has exactly the same organization as the window for comparing all regional results, except that only the information of the current window is available. Please refer to the description there for more details.
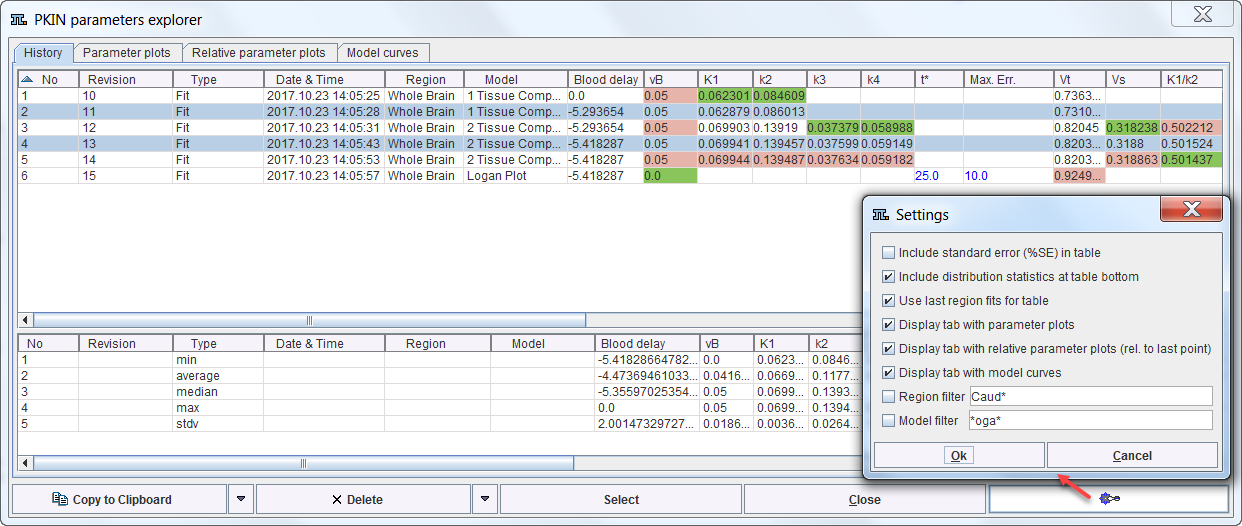
The upper part of the History panel lists the model configurations in rows. The initial columns are descriptive, followed by the actual parameters. Note that the parameters are sorted into appropriate columns even across different model types. For instance, Vt resulting from all compartment models as well as the Logan plot appears in the same column so that the values can easily can be compared. The user can change the order of the columns by dragging the column headers left or right. The smallest value per column is encoded in green, the largest in red. Columns having a constant value are encoded in blue. The No column refers to the chronology of list entry. Revision serves for grouping results from a certain task such as the parameter sensitivity analysis. Type indicates by what process the configuration was added. The list can be flexibly sorted by clicking on the column headers.
To restore a model configuration double-click the list entry or mark it in the list and activate Select. Model configurations can be removed by selecting them in the list and activating Delete. The Clear All button
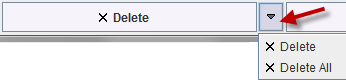
allows resetting the history completely.
Optional Elements
The window has some configuration Settings which can be opened as illustrated above. The elements to be changed are:
Include standard error (%SE) |
Include a column with the % standard error for each parameter. |
Include distribution statistics |
Enable the lower area showing the min, average, median, max and stdv per column. |
Use last region fits for table |
Not relevant for the fitting history of a single region. |
Display tab with parameter plots |
Shows an additional panel for the visualizing the parameters of the selected History rows as curves. |
Display tab with relative parameter plots |
As above, but with normalization to the last value. |
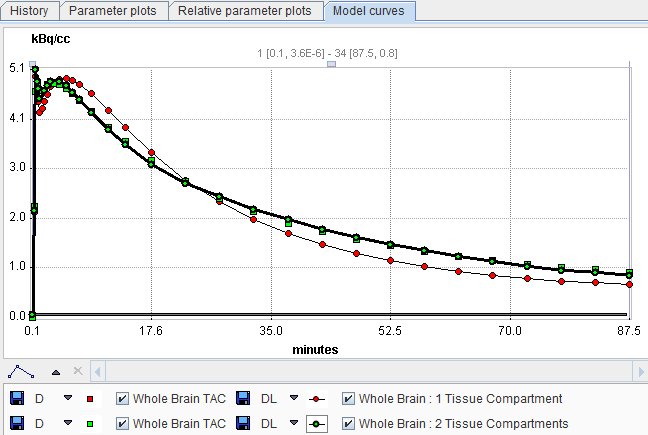
Display tab with model curves |
Shows an additional panel for concurrently visualizing the model curves of the rows selected on the History tab. |
Region filter |
Not applicable here. |
Model filter |
For filtering the entries listed. With *Comp*, for instance, only compartment model results will be listed. |
Saving Options
There are different types for saving the parameters from the fitting history using selection in the lower left.
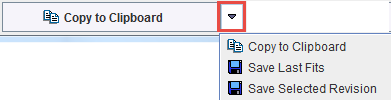
Copy to Clipboard copies the entire window contents, so that it can be pasted into another application for further analysis. Save Last Fits saves the latest fit results from all regions into a .kinPar file. Save Selected Revision saves the fits from all regions with the currently selected Revision number to a .kinPar file and can be used for exporting the results from a duration sensitivity analysis.