Several models involve fitting of a (linear or multi-linear) regression model which only becomes valid after a certain equilibration time t*. Typical examples are the Logan and the Patlak analyses. In these cases, t* can be manually specified, or fitted during model preprocessing using some target tissue TAC.
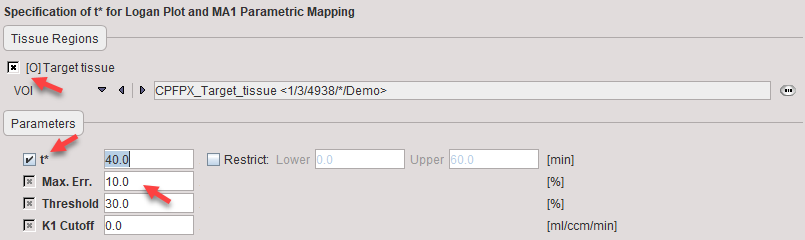
In the Model Preprocess panel the following has to be configured for t* fitting as illustrated below:
•The target tissue has to be enabled and a meaningful tissue TAC specified.
•The t* fit checkbox must be checked.
•A suitable error criterion Max. Err. should be entered.
Then the following optimization is performed during preprocessing:
1.t* is set to the beginning of the first frame.
2.The regression model is calculated using the data from t* to the last frame.
3.The maximal relative difference (measured-predicted)/predicted between the regression value and the data value is calculated.
4.If the maximal difference exceeds Max. Err, then t* is set to the subsequent frame and the loop continues from point 2.
5.Otherwise, the current value of t* is returned and the final regression is calculated.
The preprocessing result will be shown on the Model Result panel as illustrated below for the Logan plot. In this example, a t* of 10 minutes was found. This means that the frame starting at 10 minutes and all following frames are employed for the analysis, both in the preprocessing as well as in the pixelwise processing. Note that t* is always entered in real acquisition time, while the "time" used in regression is sometimes the result of a transformation.
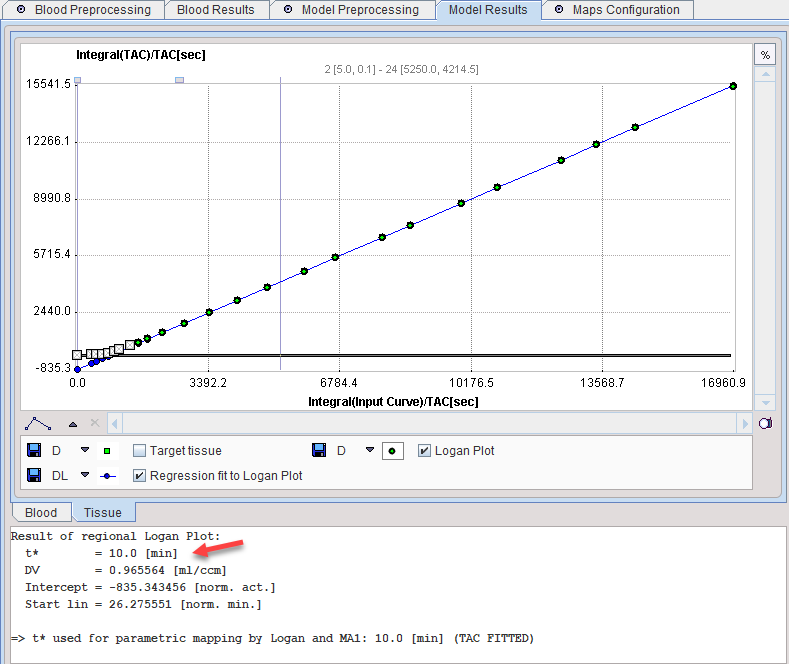
Note: The illustrated fitting of t* may result in an early equilibration time not suitable for all tissues. It is recommended to use longer times than the 10 min illustrated in the example above.
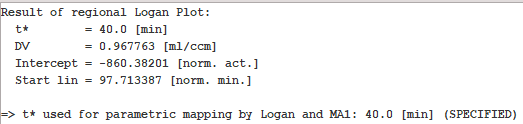
To specify a later t*, return to the Model Preprocessing panel, disable the t* fit box, and enter a realistic value such as 40 min.

Preprocess Model will then calculate the Logan plot with fixed t*=40min and output the following information on the Model Results pane.