In 2009 Zhou et al. introduced a new graphical method, the Relative-Equilibrium (RE) plot [1]. It can be applied with a plasma input curve for the calculation of the distribution volume, and with a reference tissue curve for the calculation of the binding potential. It was shown with Raclopride data and with simulations, that unlike the Logan plot the RE plot is not suffering from bias due to high noise levels. As a consequence, the results obtained with VOI-averaged TACs is consistent to the results obtained in pixelwise applications.
However, it was found that violation of the relative equilibrium condition did introduce bias. To compensate this bias Zhou et al [2] combined the RE plot with the Gjedde-Patlak plot in a bi-graphical manner called the RE-GP Analysis.
The operational equation of the RE Plot is given by:
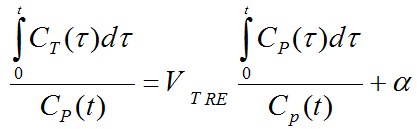
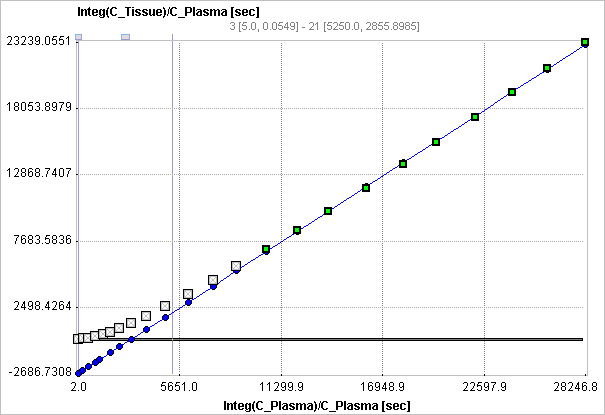
For the RE plot to be applicable there must exist a time t* after which two conditions are fulfilled:
1.The plasma input curve must be mono-exponential. This condition can be verified by fitting a single exponential to the late part of the plasma curve on the Blood tab of PKIN.
2.The ratio of CT/Cp is constant. This condition can be verified by switching the KM model to the Tissue/Plasma Ratio model.
Under these conditions the tracer in all tissue compartments reaches equilibrium relative to plasma. Note that the conditions must be verified explicitly, because the linear appearance of the RE plot is not a sufficient criterion.
Violation of the relative equilibrium condition above introduces bias. To compensate this bias the RE plot was combined with the Patlak plot
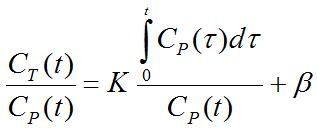
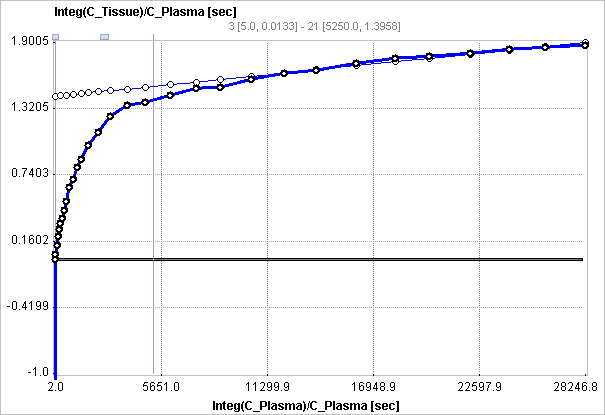
using the same t* for fitting two respective regression lines. A consistent and unbiased distribution volume is then obtained by combining the slopes and intercepts of the two plots:
![]()
Overview of the RE-GP Processing in PXMOD
The preprocessing section of the Vt (RE-GP Analysis, Zhou) model serves for the specification of t* and the smoothing parameters. The user may specify an error criterion and fit t* for a representative tissue TAC, or directly enter t*. The t* resulting from preprocessing is applied for the pixelwise fits.
For each pixel, the slope and intercept of the regression line to the Patlak plot are calculated. The resulting parametric maps are then smoothed. Finally, the regression line to the RE plot in each pixel is calculated in each pixel. Vt obtained from the RE plot is corrected using the smoothed outcome of the Patlak analysis according to
![]()
where Ks and βs are obtained from spatially smoothed maps of K and β.
Acquisition and Data Requirements
Image Data |
A dynamic PET data from a receptor tracer with reversible binding. |
Blood Data |
Input curve from the time of injection until the end of the acquisition. |
Blood Preprocessing
Decay correction is the only blood correction option.

Model Preprocessing
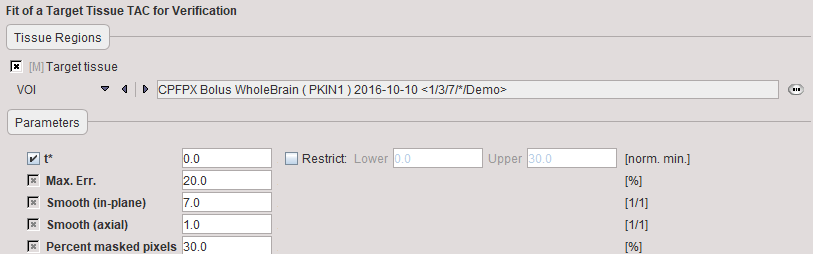
t* |
Start time of the data segment used in the analysis. If t* is checked for fitting, the Max. Err. criterion will be applied to the RE plot of the specified tissue TAC. |
Max. Err. |
Maximum relative error ( (measured-predicted)/predicted ) allowed between the linear regression and the RE-transformed measurements in the segment starting from t*. |
Smooth (axial) |
Spatial smoothing window along z in number of pixels. A number of 1 means planar smoothing. |
Resampling |
Sampling increment applied during the basis function calculation. |
Percent masked pixels |
Exclude the specified percentage of pixels based on histogram analysis of integrated signal energy. Not applied in the presence of a defined mask. |
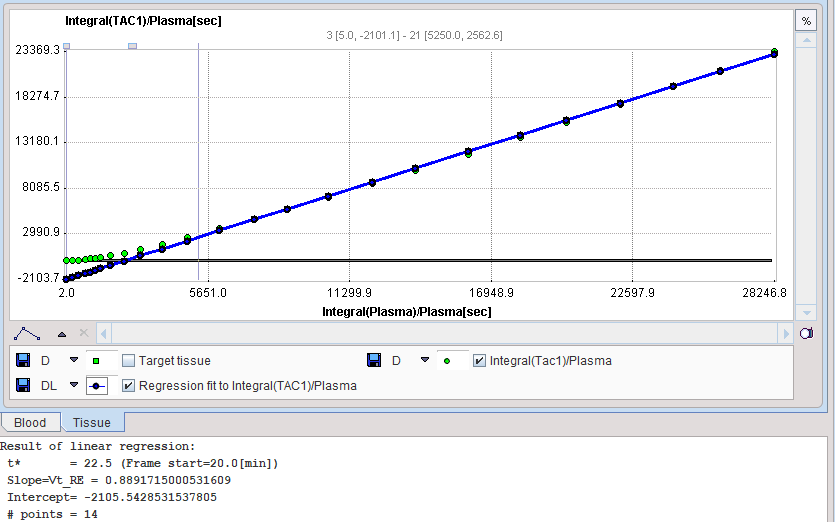
The RE-GP plot is shown in the preprocessing Model Result panel. The user should consult this plot in order to check whether the Start time is adequate.
Model Configuration
The example below shows a typical configuration for an irreversible mode (k4 = 0 fixed)
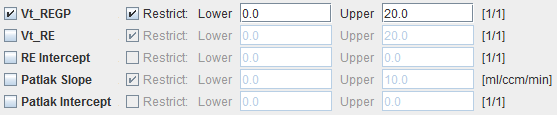
Vt-REGP |
Distribution volume of total ligand uptake in tissue. Insensitive to non-equilibration bias. |
Vt_RE |
Slope of the regression line to the RE plot and also a distribution volume estimate. If the equilibrium condition is not satisfied, this Vt estimate is biased. Default is therefore not to use Vt_RE, but it can enabled for inspection. |
RE Intercept |
y-Intercept of the regression line to the RE plot. |
Patlak Slope |
Slope of the regression line to the Patlak plot. |
Patlak Intercept |
y-Intercept of the regression line to Patlak plot |
References
1.Zhou Y, Ye W, Brasic JR, Crabb AH, Hilton J, Wong DF: A consistent and efficient graphical analysis method to improve the quantification of reversible tracer binding in radioligand receptor dynamic PET studies. Neuroimage 2009, 44(3):661-670. DOI
2.Zhou Y, Ye W, Brasic JR, Wong DF: Multi-graphical analysis of dynamic PET. Neuroimage 2010, 49(4):2947-2957. DOI